September 3rd, 2010
Published Daily

December Gold Looks Set for Another Leap

by Rick Ackerman on November 10, 2009 1:09 am GMT · 5 comments

December Gold’s overnight surge yesterday brought it to within two ticks of an 1111.90 target we’d been using to keep us properly bullish for the last $55 or so of the rally. Where to next?  We’ll give you our best guess in a moment, but let us caution that we treat every top on the hourly chart as potentially important, since one can never can tell whether the correction that ensues will be the one that leaves bulls distraught, confused and gasping for breath. Actually, you often can tell, if you are patient enough to monitor price action on the lesser charts diligently. The logic of this is straightforward, since it is impossible for the major trend to change without signaling it first on the lessercharts. Thus, if an ageless bull market is about to give way to the worst bear market in history, the very first warning of this will occur in the form of a microscopic abcd downtrend on the one-minute bar chart. 

If-December-gold-takes-out1 

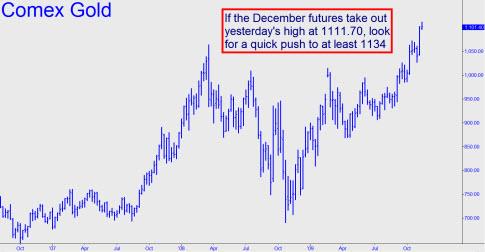
We doubt such troubles lie in store for Comex gold, however. Even though the December contract dropped back $10 to end the day, we are still holding to an 1134.50 target that has been a long time in coming. Quite a long time, actually, since it was first signaled back in May when gold was trading around 935.  Accordingly, we’re advising subscribers with long-term positions to lighten up if and when the rally hits 1134.50, a “Hidden Pivot” resistance.  We strongly expect a tradable pullback from that number just as we are seeing from 1111.90.  Please note, however, that if the rally were to push past the 1134.50 target by as little as $2-$3 on the day it is first hit, we’d infer there’s enough buying power for a short-  to intermediate-term finishing stroke to at least 1174.90. 

Save $200 on
The Hidden Pivot Webinar.

Offer extended through Friday (9/3).

Two Subscribers Score 

Whatever happens, Rick’s Picks subscribers seem to be making excellent use of Hidden Pivot targets disseminated each day in the newsletter and chat room by helpful “pivoteers” who have taken the online Hidden Pivot seminar. “You guys are the bomb!” gushed one chat-room regular yesterday. “I just closed a trade [in gold futures] for $50,000! That is huge for me…made half my annual salary in six weeks.”  Another subscriber appears to have done even better: “I wanted to thank you again for the Hidden Pivot technique,” he texted. “I mainly trade stocks using my own Hidden Pivot patterns. Trades over the last couple of weeks (which have received my full attention) have almost netted profits equal to my annual salary. Enhanced risk control is key.” 

Indeed. Of course, past performance is no guarantee of future success, and both of these guys may merely have been lucky. Also, no matter how accurate the forecasts, there will always be substantial risk of loss in trading futures and options. Let the buyer beware! 

(If you’d like to have Rick’s Picks commentary delivered free each day to your e-mail box, click here.)

Bookmark and Share
Ads are by Google and do not represent the views of Rick's Picks or its affiliates.
More on this topic (What's this?)
Gold and Silver Ready to Fly?
Gold: The Next 6 Months
Read more on Gold at Wikinvest

{ 5 comments }

Senor Cuidado November 10, 2009 at 9:16 am

Bernanke: Listen, I need you guys to come out with a sell recommendation on the dollar.

IMF: What?

Bernanke: And be sure to use the word “overvalued”.

IMF: What?

Bernanke: Just do it.

Senor Cuidado November 10, 2009 at 4:29 pm

Yesterday rattled a few cages. But not this guy:

http://www.marketwatch.com/story/market-timer-throws-cold-water-on-rally-2009-11-10

One of the stock market timers I monitor who currently is quite bearish is Peter Eliades, editor of the Stockmarket Cycles advisory service. It is tied for second place for performance since October 2007, when the stock market reached its all-time high, having produced a 7.3% annualized gain. Over the same period, the stock market itself suffered a 14.7% annualized loss.

In an email to clients, following Monday’s 204-point rise in the Dow to a new recovery high, Eliades reviewed a number of technical reasons why the rally is on shaky ground. Three of the leading reasons are:

•Even after rallying so impressively in recent sessions, the stock market has merely made it back up to the downtrend line from the October 2007 high.

•The rally has come on progressively lower volume: “The market has now advanced for six consecutive days on a closing basis. Each of those days has seen lower volume than the preceding day except for today [Monday] which saw a slight increase in volume above Friday’s volume but was still below Thursday’s volume.”

•The Dow’s new high was “unconfirmed by virtually every other index or average. In fact, some of the indexes such as the Russell 2000 index of smaller cap stocks have performed very poorly on a relative basis compared to the Dow. The Russell 2000 actually reached its top on Sept. 23 and has now retraced just over 50% of the losses from that high. It is nowhere near either its September or its October high. The same is true for unweighted indexes, such as the Value Line Arithmetic and the Value Line Geometric.”

To be sure, Eliades concedes that he didn’t expect the market to rally as far as it has already. And continued strength could lead him to “completely change the market’s intermediate to longer-term outlook.”

In the meantime, though, he believes that Monday’s action was a “final fake-out move to the upside.”

&&&&&

Peter is a friend whose work I have featured often at Rick’s Picks, although not recently. Like me, he is more or less a permabear, but his bias during the Great Bear Rally of 2009 has been more incipiently bearish than my own. He also follows a number of indicators, such as Hindenburg, that have been made obsolete by the the rally. I tend to categorically reject any indicator, particularly cyclical, that supposedly is saying something dramatic is about to happen. All such indicators have been wrong for too, too many years./em>. RA

Rich November 10, 2009 at 4:43 pm
Rich November 10, 2009 at 5:50 pm

External debt/GDP is the total public and private debt to GDP ratio, and a measure of how leveraged an economy is, hence how likely to deflate:

For some offroad surprises:

http://en.wikipedia.org/wiki/List_of_countries_by_external_debt

The dollar looks pretty good compared to the Euro…

******

Submitted on 2009/11/10 at 6:13pm
Insightful discussion of BRK, economy and WEB:
http://www.cnbc.com/id/33797214
Rosie says $2750 gold and it makes headlines.
Pretty good sign of a top.
http://www.dailyfinance.com/2009/11/10/gold-at-2-750-an-ounce-heres-how-it-could-happen/print/

********

71.142.205.47oSubmitted on 2009/11/10 at 6:16pm
Rosie [David Risenberg] says $2750 gold and it makes headlines.
Pretty good sign of a top.
http://www.dailyfinance.com/2009/11/10/gold-at-2-750-an-ounce-heres-how-it-could-happen/print/
richcash8@gmail.com

******

Submitted on 2009/11/10 at 7:50pm
We like QID above 21.11 and SZK above 43.87.

gary leibowitz November 11, 2009 at 12:04 am

I find it interesting how most people view the stock market’s last 6 months as an anomaly that can’t be explained, yet they find many reasons why Gold should continue to shine.

Historical data should not be ignored in economic/market extremes. The 30’s were a perfect example. Current conditions call for an even greater market reaction, including irrational behavior. We have gone higher and longer than the 30’s rebound but the end will be the same. Patience is needed.

I have had a target for what seems like forever in that the SPX will peak between 1140 and 1220. We have seasonality to consider and the fact that most terminal rallys usually end with a sustained and steep run-up for perhaps as much as one month. Is this run up the last one? I have my suspicions it isn’t. In fact there is a very good chance that if the market faulters in the next few weeks, it will be met with a dramatic rally.

Hindenburg Omens have a track record of almost 100 percent. In fact I can’t think of any recorded crash that didn’t have one prior to its demise.

The practice starting with BUSH and continuing today, is the worlds concerted effort to allow the dollor to fall. It has done wonders so far.

While current technicals are pretty horrendous for equities any correction will be met with a sharp rally, at least till the new year. Gold and most commodities are up for the same reason equities are; the fall in the dollar and expectations that that will result in hyper-inflation down the road has lifted all.

Just one mans opinion.

Comments on this entry are closed.