
Yesterday’s rally on Wall Street added a few extra ounces of credibility to a buying binge that we’d initially regarded as mere noise in a newly re-energized bear market. That could still prove to be the case, although we are close to giving bulls the benefit of the doubt for the moment. The hourly chart below shows why. Tuesday’s binge began with a leap at the opening bell, and buyers never looked back. The result was a thrust that surpassed four prior peaks without pausing for breath. Since we require merely a two-peak breakout on the hourly chart to signal a potentially meaningful trend change, we might infer that this rally has the potential to go a ways. Will it be just a 400-meter sprint, ending soon in exhaustion? Or are buyers perhaps warming up for a 5000-meter run to new recovery highs?
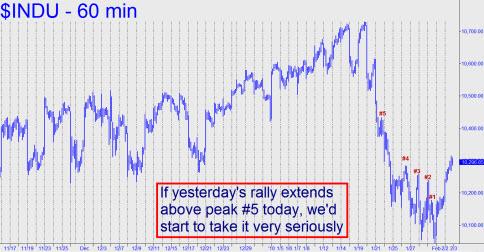
If the Dow is indeed bent on challenging mid-January’s peaks some 500 points above these levels, we should expect to see a strong follow-through today, with a gain at some point during the session of at least 136 points. That would push the Industrial Average above the small peak at 10433 shown in the chart, refreshing the bullish trend in the process. According to the proprietary Hidden Pivot Method that we use to trade and forecast stocks and commodities, the best evidence of a strong and durable trend is one that surpasses an old peak with each new thrust. That is why we’ll be monitoring DJIA 10433 today. Ordinarily, we would use Hidden Pivot targets to gauge the strength of any rally. In this case, however, two numbers used in more traditional forms of technical analysis may be more helpful: 10387.24, and 10468.08. These resistance points represent, respectively, a 50% retracement of the decline from January 19’s 10730 high, and a 0.618 retracement. The lower number is our minimum upside objective for the near term. As always, it will be caveat emptor.
(If you’d like to have Rick’s Picks commentary delivered free each day to your e-mail box, click here.)
The long term major support areas are 1150 and 1238 on the SPX.
It looks like we should hit the higher one before it all falls apart.