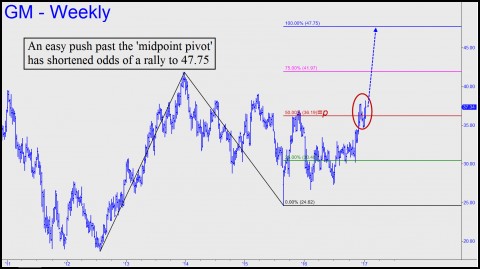
 Investors who have been betting heavily on Trump since the election may be starting to wonder whether the stock market has overshot the bounds of their initial optimism. To be sure, this is an insubstantial brick in the proverbial wall of worry that is said to keep bull markets alive. But are the broad averages about to take a Wile E. Coyote plunge from record heights? Whatever happens, with the stall at these levels about to enter its sixth week, something’s got to give. Will shares pull back in order to get a running start for a leap to new highs? Or will the pullback instead turn out to be the start of a bear market? These are the two possibilities that seem most compelling at the moment. A third — that bulls will go on another rampage without a significant retracement, is highly unlikely in my view. You can see this in the chart, which cries out for a selloff painful enough to disabuse investors of the notion that there’s easy money to be made by simply sticking with an obvious and powerful trend. As to the possibility that the selloff would prove to be more than a mere correction, there are indeed reasons for caution. Chief among them is the possibility that the slowdown in the housing sector evident in Q4 will worsen, possibly enough to drag the economy into recession. Auto manufacturers will be feeling the pinch of higher interest rates as well, although you wouldn’t know it from examining their charts. The one shown makes a strong technical case that GM shares will be trading 28% higher in six to nine months. If so, Trump will have succeeded beyond the most bullish hopes of those who voted for him, if not beyond his own expectations.
