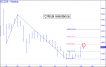
We may soon know whether gold is back on the recovery path or even the warpath. It all depends on how bulls handle the 4530.10 midpoint resistance shown. Last week's timid rally was a step in the right direction. Now, if they impale the Hidden Pivot, and especially if they close this erstwhile brick above it for two consecutive bars, that would be strong evidence of a resurgence capable of powering the futures not only to 5000 but also to a test of January's record 5781.
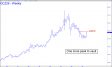
Did gold's bear market end with the 4016 low recorded a month ago? We'll likely have a definitive answer next week if the powerful upthrust of the last two days continues, exceeding the 4465.90 peak shown. That would mean the futures had exceeded two 'external' peaks on the weekly chart without a pullback, indicating that an exceptionally powerful impulse leg is in progress. It would presumably be strong enough to break the back of a bear market begun from a record 5782 last January. The minimum upside target thereupon would be 4819.30, still well shy of the old peak but a good start on it. Check the chat room for precise guidance if the futures should swoon, since that could set up an excellent buying opportunity down near 4200.

I've set a high bar at 4403.70 to signal the possible end of a bear market that began in January, when the August contract hit a record 5700. Otherwise, we should expect the weakness to continue at least until the 3793.40 target shown in the inset is achieved. There are two more Hidden Pivot supports you should be aware of, since either is capable of reversing the trend at least temporarily: 3822.70, the target of a smaller pattern that was featured here last week; and 3603.40, a worst-case projection derived from sliding 'A' up to the 5513.00 'marquee' high recorded on March 2. Of the three possibilities, I favor 3793.40, which is why I have boldfaced it. The other two will work well for careful bottom fishing, however. _______ UPDATE (Aug 2, 3:08 p.m.): Gold spent the entire week trading inside the previous week's range, so there is no change in my forecast. ______ UPDATE (Aug 3, 12:35 p.m. EDT): The action has shifted to the December contract, so I will start tracking it in this update. The pattern shown in this chart suggests it is headed down to 3876.10, a back-up-the-truck number. The pattern is too obvious to work precisely, but it is sufficiently compelling for us to infer that a tradeable upturn is very likely to occur at or very near 'D'. Because the flirtation with p=4169.60 has been a vague, meandering affair rather than the impalement we look for, there can be no guarantees that D will be reached. If the futures are in the process of reversing from p2=4022.90, they will signal it definitively with a move above two 'external' peaks, the second of which lies at 4298.60 (June 21).
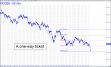
The simmering geopolitical crisis has been insufficient to prop up gold against relentless selling ever since prices hit a record 5700 last February. Now the February contract lies within an inch of a 'secondary' Hidden Pivot support that has resisted the downtrend for several weeks. The mildly encouraging news is that a 3822.70 target $200 below could provide support. It comes from a pattern much too obvious to work precisely, but it will work nonetheless, possibly repelling bears with enough vigor to jump-start the bull market. However, there is a more compelling target beneath it at 3630.70 that you should fix in your minds. It is more closely congruent with the 82.46 target we've been using in GDXJ (see below). So as not to leave things too glum, my best-case alternative would be a rally surpassing June 21's 4238.10 'external' peak. That would probably end the bear market, but I don't consider it likely.
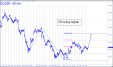
The futures triggered a 'mechanical' buy signal last Wednesday when they dipped to the green line. This implies they are no worse than an even bet to achieve the 4312.80 'd' target in the chart shown. They'll have to do at least a little better than that to suggest the rally is capable of getting legs. Most immediately, that would mean pushing past the 4403.60 peak recorded in mid-June. That would generate an impulse leg on the daily chart capable of hitting 4746.60, if not necessarily new record highs.
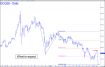
Gold's modest rally last week looks like it could go a tad higher before sputtering out at 4312.80. the d target of a minor, bullish pattern. The downtrend that follows should take the futures to 3795.20, a Hidden Pivot 'D' support associated with a pattern begun from 5323.00 in early March. Bulls could expect a pretty good ride thereupon, since it will have taken more than four months to trace out the pattern, part of a larger correction begun from the record 5700 on January 29. Alternatively, we should allow for the small possibility that a major correction ended with last week's 3955 low, and that a lasting rally is under way. If this is so, buyers will demonstrate it with a fist-pump through 4312.80, and thence a follow-through exceeding the 4527 'external' peak recorded on May 29.
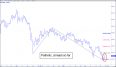
Bulls will need to push this brick up to the green line (x=4173.40) to earn the benefit of the doubt. That would trigger a 'conventional' buy signal with immediate potential to hit the midpoint Hidden Pivot resistance (p) at 4371.30. The two-day rally that ended the week was a feeble start, but buyers could be emboldened if the dollar index's so-far moderate downturn from an important Hidden Pivot rally target at 101.78 gains momentum. ______ UPDATE (Jun 29, 12:42 p.m.): The bad news that I somehow neglected to provide on Sunday is that 'this brick' is likely headed down to at least 3822.70, a further fall of 4.2% from a current 4035.
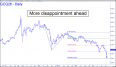
Brace for more disappointment in the days and weeks ahead, since the futures give every indication that they'll continue falling to at least 3795.20, the 'D' target of the pattern shown. Gold will have given up a third of its peak value if that happens, a middling bear market. A rally in the meantime to as high as the green line (x=4664) would be widely interpreted as bullish, but Hidden Pivot analysis suggests it would actually set up an opportune short sale. If you're eager for signs of a durable upturn, look for a rally that exceeds two prior peaks on the daily chart without a B-C correction. Another indicator would be corrective patterns, including those in minor-degree charts, that do not reach their D targets but instead reverse from the midpoint of Hidden Pivots. _______ UPDATE (Jun 24, 9:11 a.m.): If you are looking for a reliable way to determine when this plummeting cinder block may be turning higher for good, use TI=197.80 (a=4162 on 3/23). It already flashed one false signal with a rally that failed to reach then-p (4441.80), but I am betting that Mr Market cannot repeat this nasty trick. More immediately, if GCQ 26 can't get traction at p2=3967.90, it will continue lower to D=3822.7o (daily chart, A=4627 on 5/29)
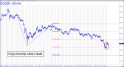
Gold caught a favorable breeze on Friday for a change, but if you're a long-term investor, I'd suggest enjoying the countertrend while it lasts. The initial breach of the 4372 midpoint Hidden Pivot support was sufficiently clear to imply that the 3800.60 target will be reached. It could turn out even worse, actually, since a bear-market low at 3606.40 is technically possible if you slide the pattern's point 'A' high up to the record (one-off) at 5493, recorded on March 2. And don't get too excited if this bounce continues all the way up to the green line (x=4617.00), since that would trigger an appealing short (stop 4954.00).
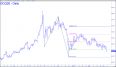
It is seldom a good sign when a trading vehicle triggers a 'mechanical' buy and then fails to reach the first profit-taking level. That is what has happened here, starting with the May 28 dip to the green line (x=4414.70). The subsequent bounce over the next day-and-a-half looked promising as it ascended toward the midpoint Hidden Pivot (p=4666.90), where we typically exit half of a position. Unfortunately for bulls, the rally fell about $30 short. Although we should always be prepared to implement a 'dynamic' or an impulsive trailing stop when a symbol we are trading approaches a target, in this case, the gap was too large to trigger that instinct. The subsequent relapse to below x would seem to offer an even better opportunity, but not in this case. The futures look too heavy for us to test our luck, and so we'll simply wait for the seemingly inevitable breach of the pattern's 'c' low at 4162.60. It is still possible to get long anywhere between 'c' and 'x' using a 'camo' trigger, but I recommend this only to subscribers who are familiar with the tactic. It is covered in detail in the Hidden Pivot Course I've made available free to subscribers.


