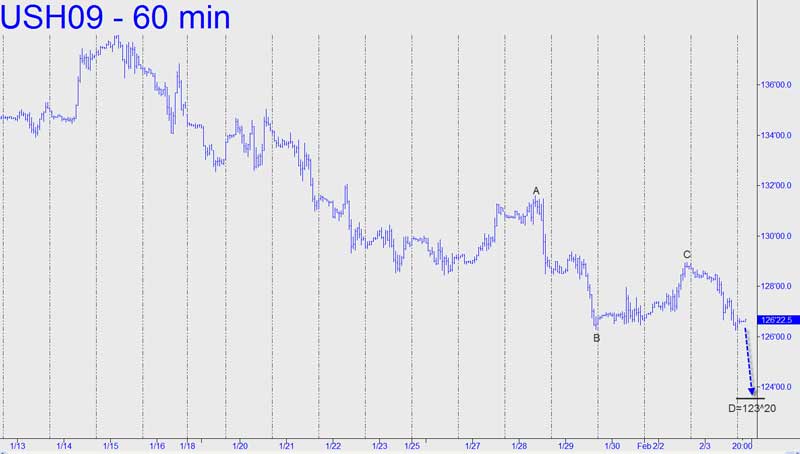
 The pattern shown in the chart looks a little too pat to rely on for bottom-fishing, but we can still use it analyticially to project more downside from here to as low as 123^20 over the near term. The sibling midpoint of that target lies at 126^09, but it is unusable for trading or analysis because it precisely coincides with the point ‘B’ low at 126^09 recorded on January 29.
