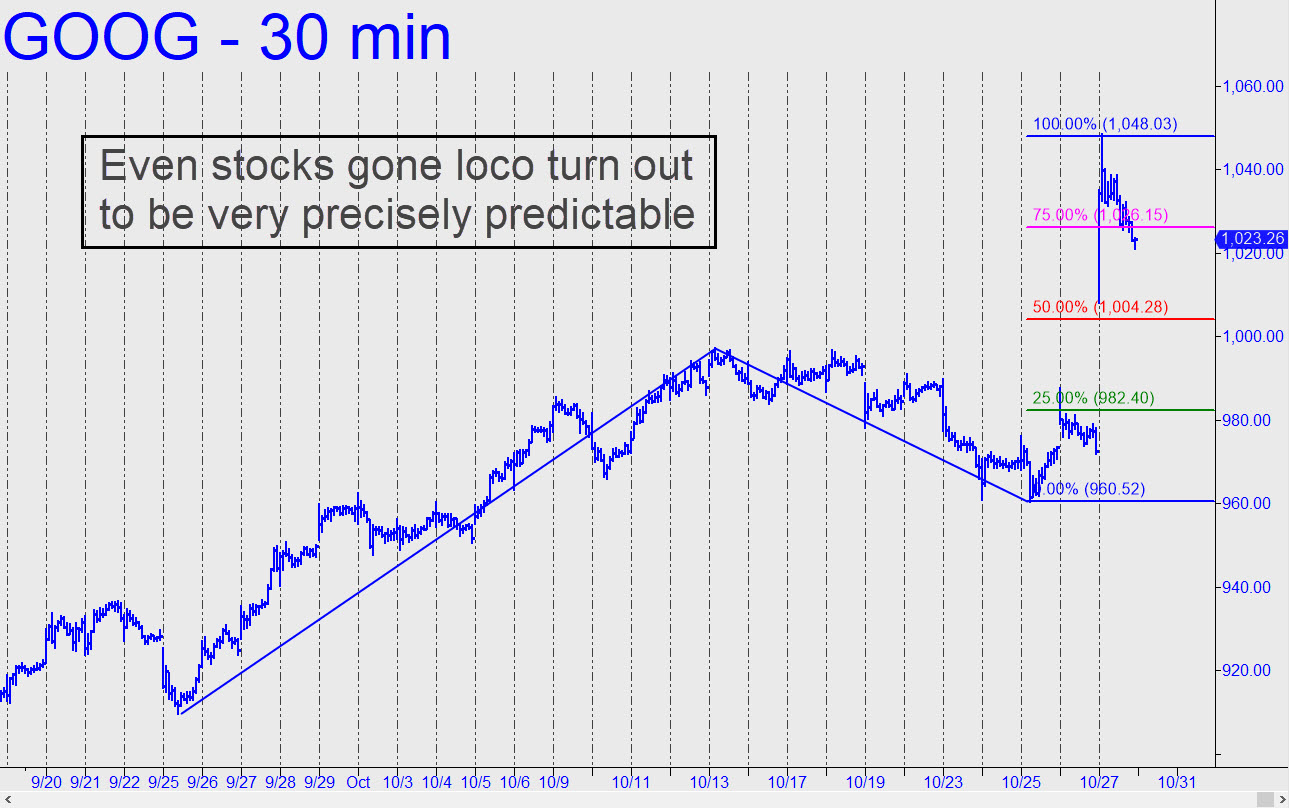
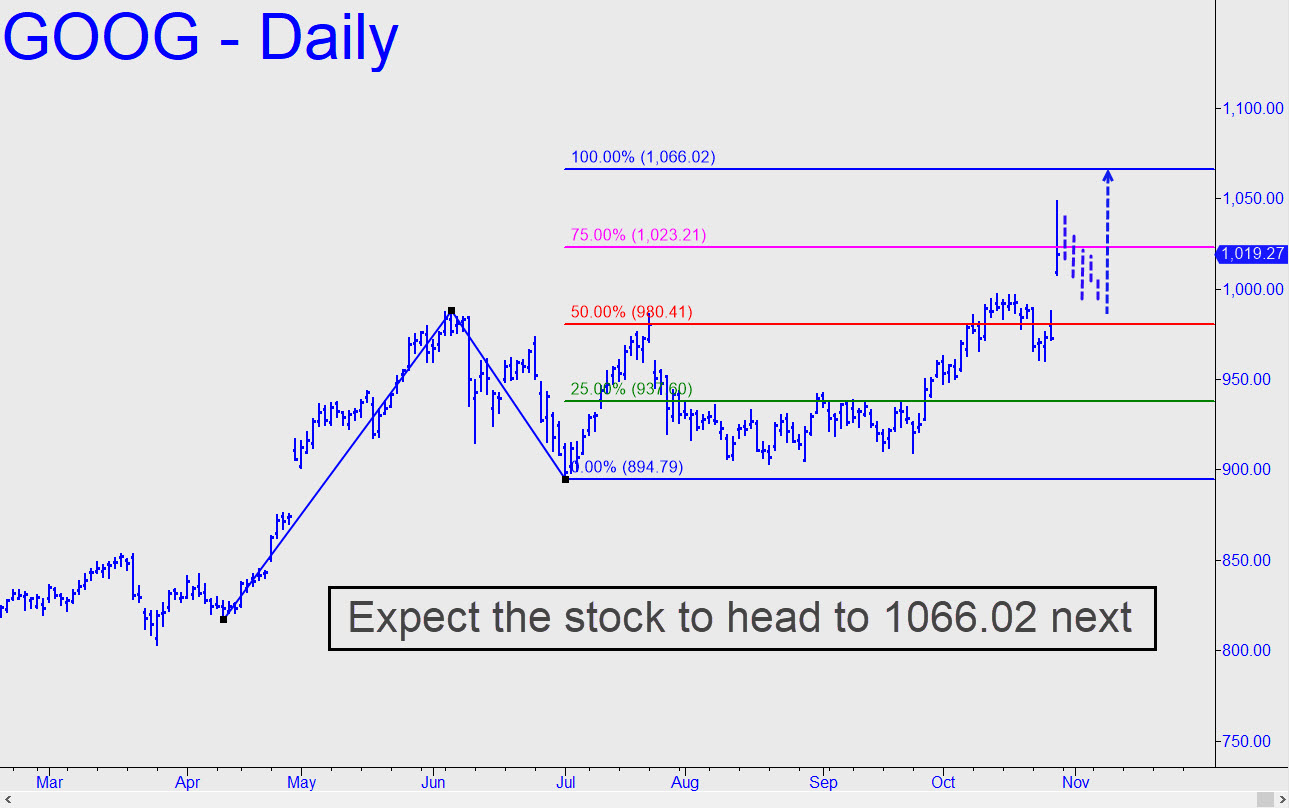
 Propelled by strong earnings announced after the close, GOOG ripped past the 1004.28 midpoint pivot shown, significantly shortening the odds of more upside to at least 1048.03, the pattern’s ‘D’ target. We’ll make that our minimum upside projection for now, implying the stock should be traded with a bullish bias until such time as it is reached. The pattern can be used in many ways to get long for at least a part of the ride north, but for now the ‘easy’ trade would employ a ‘mechanical’ bid at 982.40 (the green line), stop 960.51, provided the stock pulls back that far._______ UPDATE (Oct 27, 3:35 p.m.): GOOG’s moon shot topped at 1048.39, ever-so-slightly higher than the target proffered above. The stock has since pulled back by nearly $27 to a correction low at 1021.19. It needs more rest, so we’ll take one too. Here’s a ‘completed’ chart that you can compare to the original one in the inset. _______ UPDATE (Oct 29, 6:04 p.m.): Once it is tan, rested and ready, expect GOOG to hit 1066.02 on the next leg up. This is a high-probability target that I expect to work almost as precisely as 1048.03 did on Friday. If the stock surprises by pushing easily past this number within a day or two of hitting it, factor in additional upside to exactly 1079.67. That is a very compelling Hidden Pivot resistance, as well as the last I am able to extrapolate from the daily chart. As such, it should be regarded as a back-up-the-truck number for getting short, presumably with a very tight stop-loss. Jot it down and set a screen alert there, for sure.
