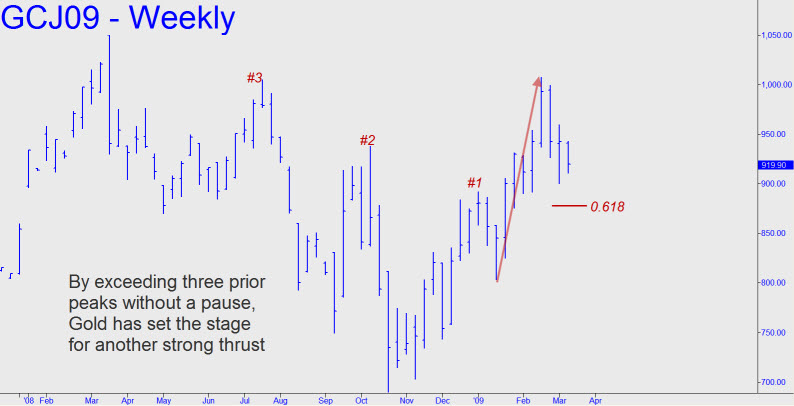
I’ve reproduced April Gold’s weekly chart as a reminder of why we shouldn’t be too concerned about the selloff that has followed the most recent push above $1000. The thing to notice is that this impulse leg, which topped at $1007 on February 20, exceeded three prior peaks on the weekly chart, two of them “external.” This suggests not only that the bull trend is quite robust, but that it is likely to produce a follow-through thrust equal to the first. More immediately, however, there is a downside target I have flagged at 886.40 (a Hidden Pivot that can be bottom-fished with a very tight stop-loss), as well as support at 881.56 that is Fibonacci-based. Together they are likely to exert a magnetic pull on Gold that augurs a further correction of at least $35 from these levels. Alternatively, it would take a print at 946.00 to turn the hour chart rambunctiously bullish. We’ll reevaluate Gold’s prospects when either of these thresholds is reached, but until then it is merely a scalp-trade best identified on the lesser charts.
