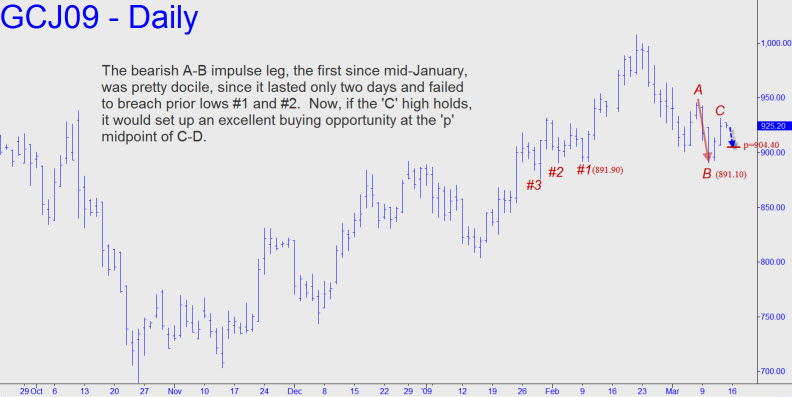
 Study the chart closely, because it would take me a thousand words to explain all that is going on here. What do we notice first? This: The first bearish impulse leg to form on the daily chart since January occurred earlier this week with Tuesday’s slight penetration of an earlier low from February 9 at 891.90. This down-leg looks pretty docile, though, since it lasted all of three days and reversed without breaching two more “external” lows that look like they should have been dead meat. So what of it? Well, for one, it could set up a nice buying opportunity at 904.40 today or Monday, provided the point ‘C’ high endures. The 904.40 target, a Hidden Pivot midpoint, also has analytical value, since its decisive breach would imply more weakness to as low as 877.20 over the near term. The only other point to make is that a rally today above ‘C’ could create trouble, since, applying the two-peaks rule (note: 964.00 is not a peak), it would mean that the uptrend would need to keep going, exceeding 1007.70, to create a bullish impulse leg to negate the “docile” A-B bear impulse mentioned above (and shown in the chart). The foregoing was not intended to make much sense to Hidden Pivot novices, but I hope that I’ve spelled things out clearly enough to help experienced Pivoteers dance an impressive samba in the chat room if they are called upon. (And if their feet are very nimble indeed, they’ll be able to find camouflage for a long entry with-the-trend if the futures don’t accommodate with a dip to 904.)
