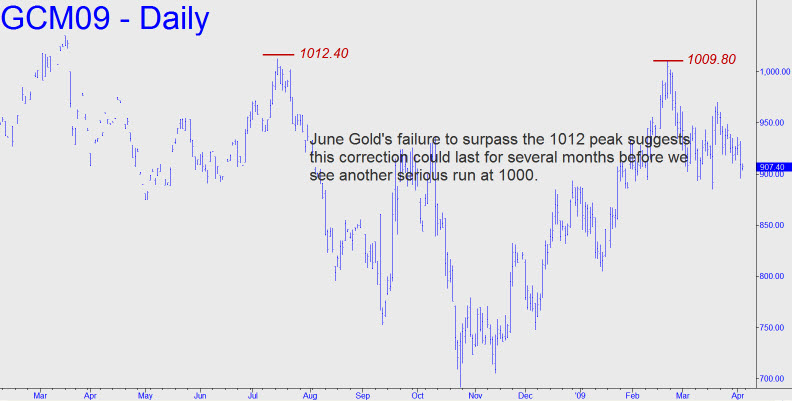
 I noticed something odd about June Gold’s chart this evening during the Hidden Pivot webinar: The February 20 high at 1009.80 did not surpass a key peak at 1012.40 recorded last July. As a result, it yields a more bearish conclusion than March Gold’s chart, where the recent peak slightly exceeded last July’s. Accordingly, my minimum downside target for the June contract is 845.20, since its midpoint sibling at 907.60 was trashed yesterday when the selloff exceeded it by more than $11. I am not going to attempt to reconcile this puzzling discrepancy between the two charts; rather, we’ll wait and see how gold interacts with the supports, and how the very minor patterns play out, to determine whether the correction is likely to exceed 845.20. However, it is somewhat encouraging that Silver’s daily charts are decisively bullish in all months.
