
Unh hee-yah! Unh hee-yah! Unh hee-yah! Gold futures have been pumping iron for more than a year — and so much the better for all of us if they weren’t up to demolishing the $1000 barrier a couple of weeks ago after getting as close as $992 per ounce. We should regard bullion’s tedious ups and downs over the last eighteen months as quiet preparation for an explosive show of strength. When it finally happens, detonation will be so powerful as to leave doubters in despair after they realize gold is trading $300 higher and they are not on board.
In the meantime, those who have been accumulating coins, ingots and gold shares can relax, since whatever disasters may have befallen nearly every other class of investable assets since 2006, the damage did not even touch gold. To the contrary, the metal has been a solid winner during that time, regardless of the state of the economy and the financial system, and despite mounting fears of inflation, hyperinflation, or deflation.
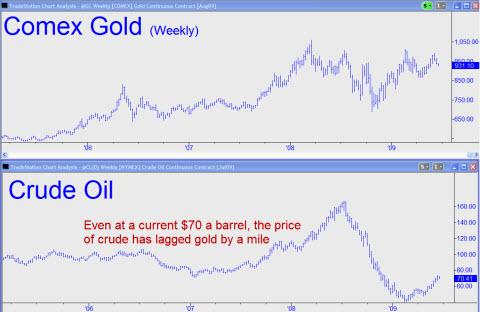
13 Barrels Per Ounce
Even crude oil at a current $70 a barrel has lagged gold by a wide margin, as the chart above shows. You could have bought six barrels of oil with an ounce of gold when both were topping out last July; now, with gold trading well off its highs, you can buy 13 barrels. We think that ratio will triple, at least, before gold has fully discounted the ongoing destruction of the dollar.
Meanwhile, even though Comex Gold has dropped $65 since early June, the technical picture looks untroubled. We’d projected a drop in the August contract to 925.50 per ounce to begin with, and yesterday that target was very nearly reached on a low of 926.50. We were buyers there, but we’d buy even more if our target gives way and August Gold eases down to the next “Hidden Pivot,” $918. Bullion bears, take note: Comex futures would need to drop a further 13 percent, exceeding $810 an ounce to the downside, to cause even minor damage to the bullish case on the long-term charts.
***
Calling All Traders…
Ever found yourself sitting on your thumbs after the opening bell, waiting for the dust to settle? If so, then you know how much harder it becomes to trade profitably as the day wears on. That’s because once a market has established an opening range, trading becomes essentially a frustrating game of second- and third-guessing other traders who are trying to second-guess you.
But suppose you were able to predict the high or low of the opening range beforehand? Using your crystal ball, you could be waiting at the bell with your bid or offer, ready to pounce on what will later turn out to be at the high or low of the day. Wouldn’t that be a trick!
That is exactly what we attempt to do each morning, using the Hidden Pivot Method to spot predictive price patterns that may have occurred overnight. If you want to see how this is done, and how precisely, please join me for The Morning Briefing each day before the opening this Monday through Thursday. These 20-minute sessions will commence online sharply at 9:00 a.m. EDT. Our goal will be to identify trading opportunities for that day, with a particular emphasis on Comex Gold futures and the E-Mini S&P. The Morning Briefing will be open to all, but to sign up you will need to register by clicking here. See you Tuesday morning!
Rick…Your oil chart shows the high breaking $160 per barrel. I remember when oil peaked…the long term contracts were trading at a discount to the near term contract high of $147. What exactly are you charting for oil?