Stocks on Monday achieved a bit less than a third of the gains we had unenthusiastically projected for the week, with the Dow Industrials settling exactly 100 points above Friday’s close. We say we were unenthusiastic in forecasting a 350-point rally because share buyers themselves have shown little enthusiasm for the task. Even so, they’ve continued to lift offers more or less steadily, producing a rising trendline with a pitch of about 12 degrees. We’ve seen steeper grades driving through Nebraska, but that’s not the point. In fact, the lukewarm, steady buying that has persisted in July is exactly the kind of buying that typically accounts for most of the stock market’s gains most of the time. This summer’s rally has been punctuated by short squeezes and gap-up openings whenever conditions have been favorable, which has been about once or twice per week.
The actual close on the Dow yesterday was 10525, exactly 232 points shy of the 10757 target sent out to Rick’s Picks subscribers Sunday night. (Get free forecasts and access to the 24/7 chat room for a week by clicking here.) If you’re a market timer, we’d suggest paying close heed to that number, since, according to the Hidden Pivot method we use to predict swing points both minor and major, it is not exactly chopped liver. We’ll likely use Diamond puts to get short if and when the opportunity arises, although we would be doing so without any preconceived notions about catching the Mother of All Tops. Simply catching “a top” is usually good enough to chase summer boredom and perhaps make a few bucks in the process, but we would be the first to acknowledge that few have gotten rich over the years by buying put options. (As much could be said of those who have bought call options over the years. Truth be told, it is a tough game, and beating it even a little bit takes every bit of knowledge that we have acquired in 35 years of option trading).
Not as Devious
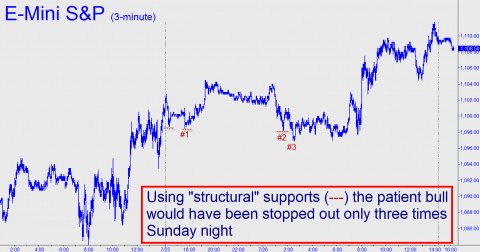
We also hope to leverage the implied 232-point rally to the target, although it is usually much more difficult to get onboard a well-developed trend than to get short at the trend’s predicted destination. We acknowledged this Sunday night in trading advice proffered for the E-Mini S&Ps. That the futures would head higher in the wee hours Sunday night seemed pretty obvious, at least to us, but we saw no easy way to catch a ride without risking getting stopped out at the obvious “structural” supports that other traders would be using. As it happens, the rally was less devious than we might have expected. The chart above shows that it aborted just thee times overnight by taking out lower lows. This hinted that Monday’s action would be bullish but not powerfully so. Strong rallies often traverse the distance between the day’s lows and highs without stopping out any prior lows on the intraday charts. The trick to catching such rallies requires only that one be a true believer the whole day. In practical terms, that means assuming that each new rally leg will unfold without much of a pause.
(If you’d like to have Rick’s Picks commentary delivered free each day to your e-mail box, click here.)


Gary Leibowitz, from the way gold price is dropping today I would say we will see the crash you spoke about pretty soon!