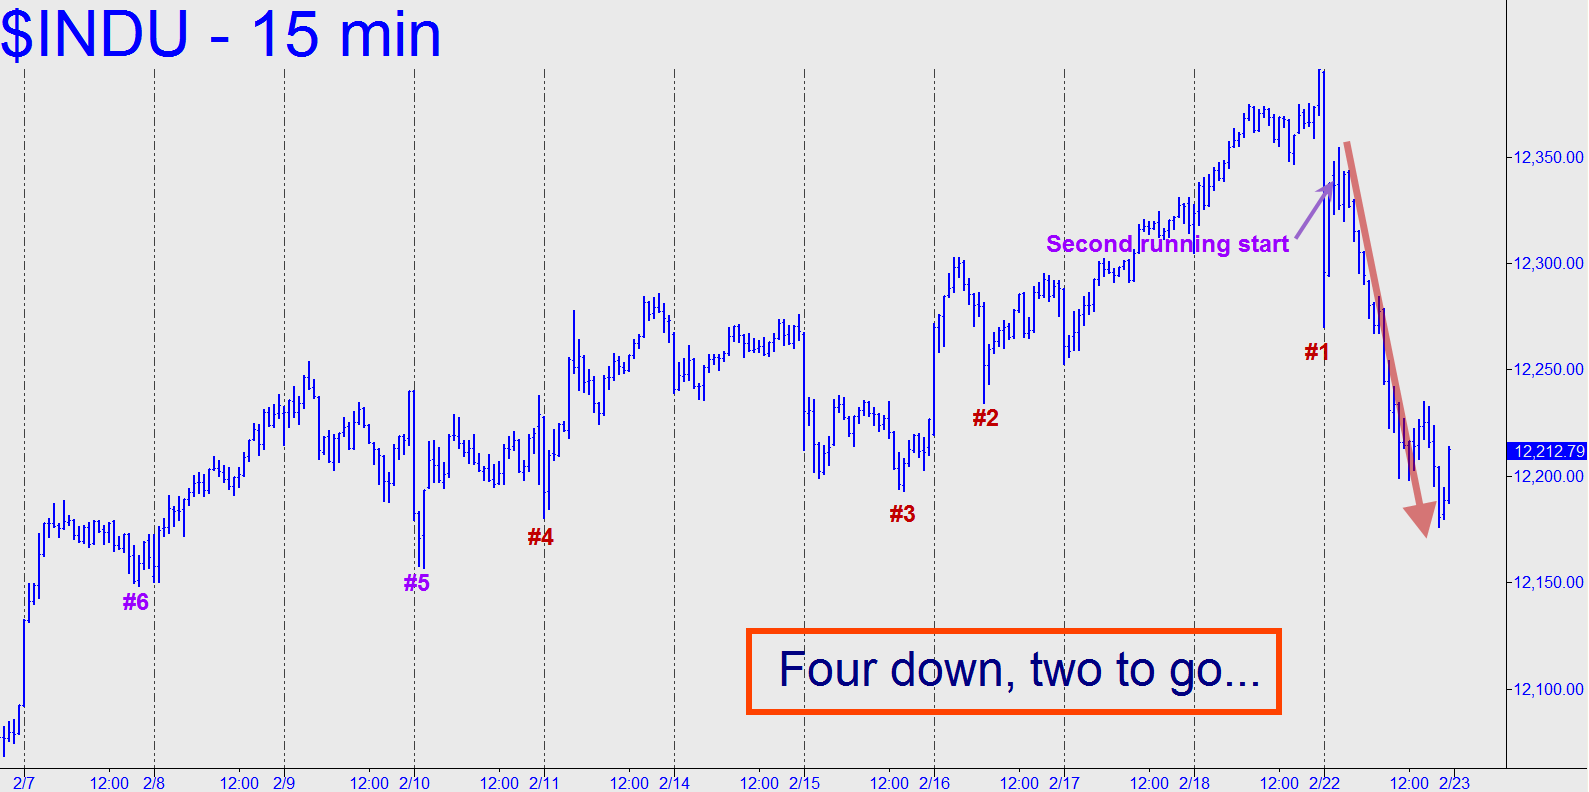
 Yesterday’s selloff needed to back up for another running start before it could achieve impulsiveness on the lowly 15-minute chart. What this implies is that the biggest single-day decline of 2011 may have been more bark than bite. We shall see, but sellers will need at the very least to extend the decline past the two “external” lows (numbers 4 and 5) highlighted in the chart if we are to take them seriously. The worst that can happen if the usual maniacs take this market still higher is that we’ll have another opportunity or two to short at great prices.
