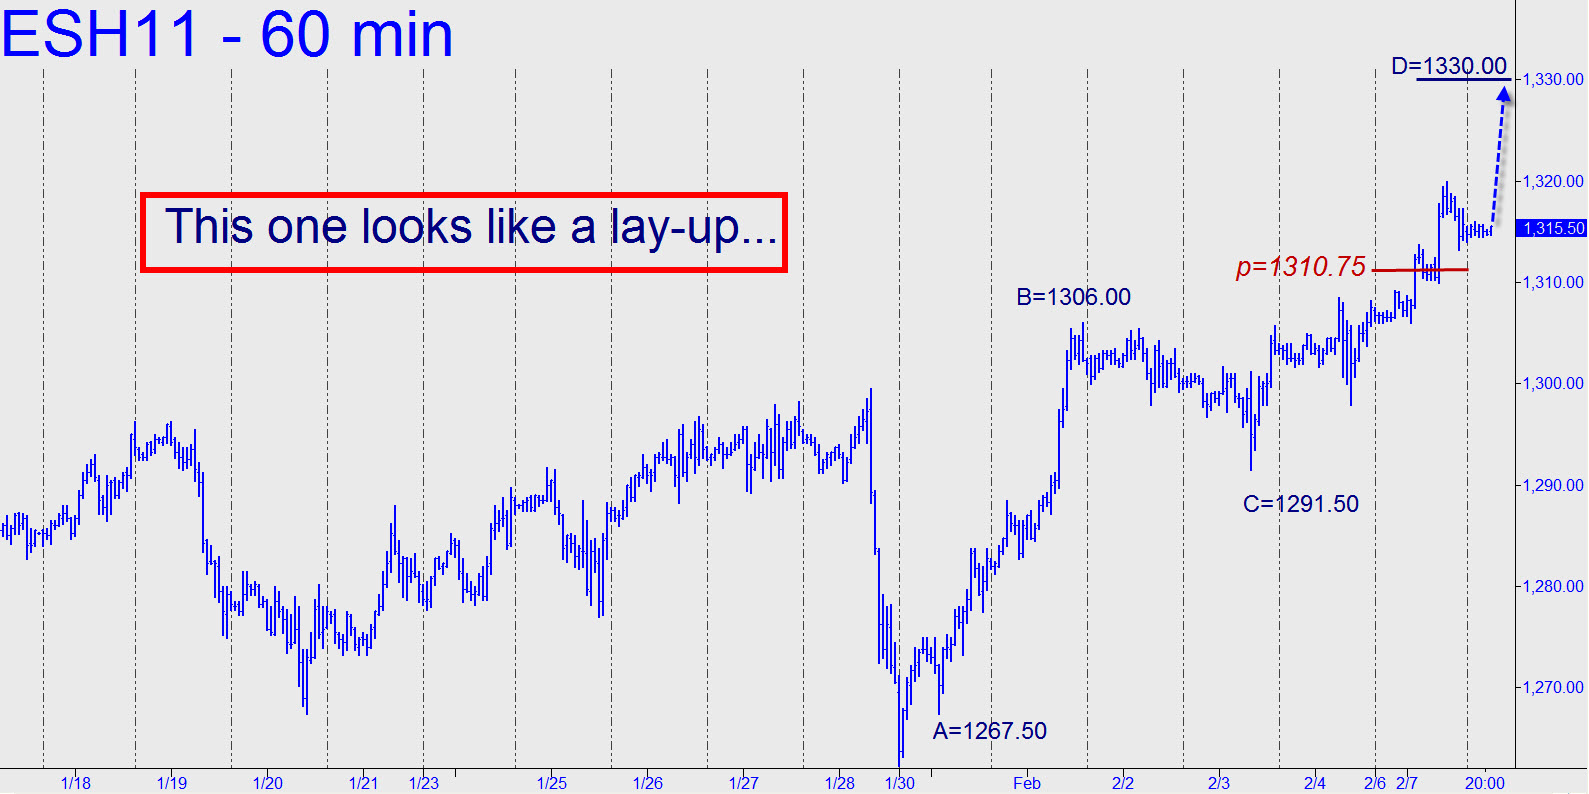
 I pored over the hourly chart to see if there was a pattern analogous to the one that allowed me to project Tuesday’s top in the Mini-Dow within a single point. For what it’s worth, there was no such pattern, but it would have required a point ‘A’ low at exactly 1241.75. (I determined this simply by working an ABC down-pattern from yesterday’s high, 1320.00.) Looking ahead, we are still relishing the thought of shorting a potentially very important Hidden Pivot at 1356.00; day trades should hew to a bullish bias until then. Most immediately, the futures appear bound for at least 1330.00, a Hidden Pivot whose provenance is shown in the chart. Note to Pivoteers: Today’s analysis has the potential to test my fondness for the one-off ‘A’. If it doesn’t work, the futures should blow past my target and top at another, 1335.25, a Hidden Pivot you can short with a 1.00-point stop-loss.
