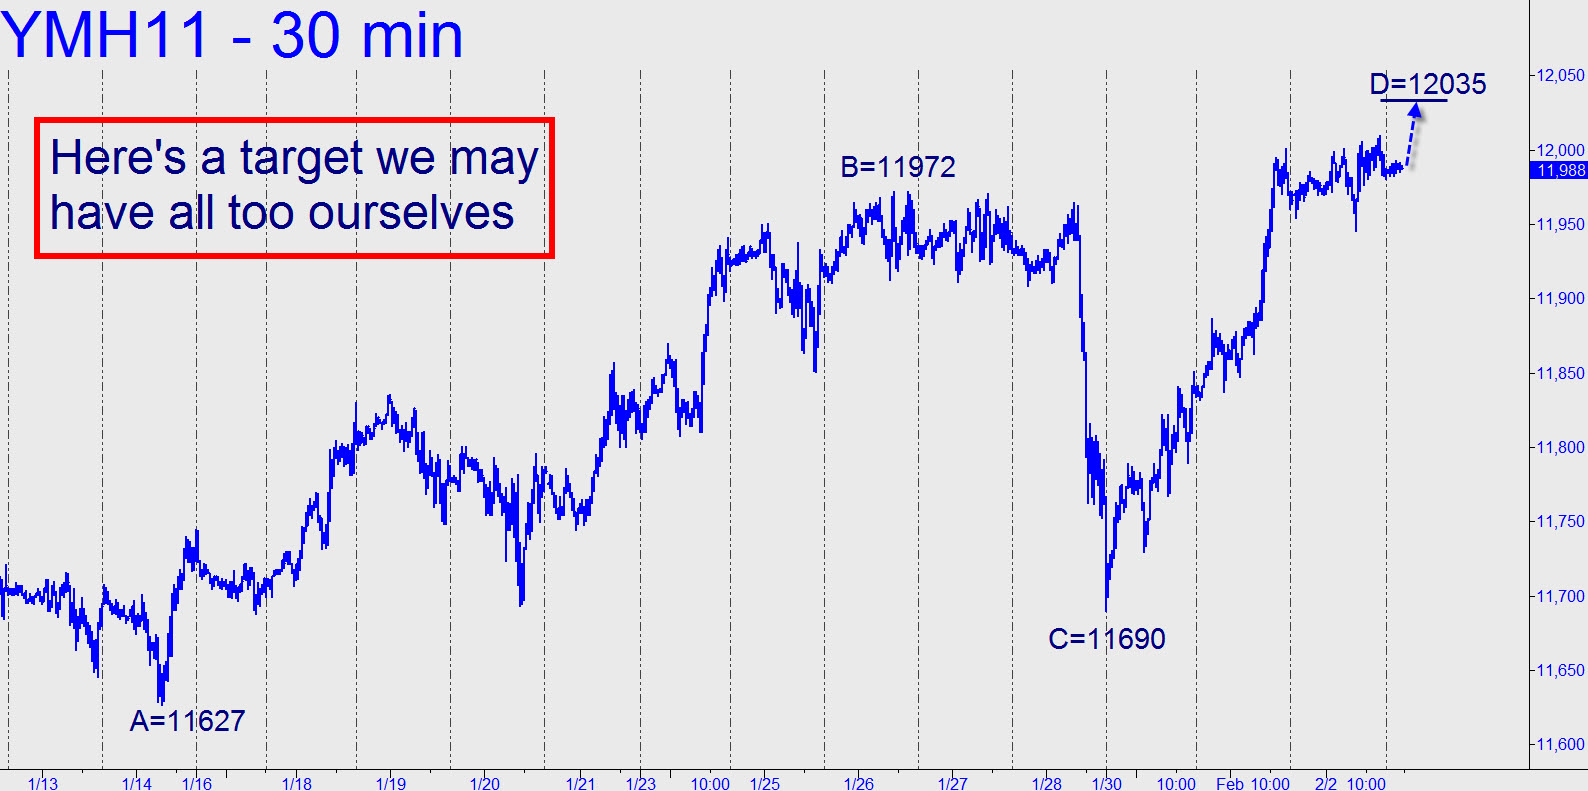
 The rally pattern shown in the chart is just gnarly enough to appeal to the twisted Pivoteer, so if you fit that description — or even if you only aspire to the dementia that day trading can sometimes induce in people who are otherwise mentally sound — let’s try shorting its ‘D’ target, 12035, via a 12034 offer and a 12038 stop-loss. The pattern is reproduced alongside for your delectation. _______ UPDATE (4:04 p.m. EST): The target was a dead-center bullseye, allowing us to get short precisely at the intraday high, 12034. A pullback so far to 12009 has provided a cushion, but anyone who took this trade in the final minutes of the session will have to be diligent in applying a stop-loss after-hours. You’re on your own now, but I’d suggest covering half of any multi-lot position at a current price of around 12012. Of what remains, keep a contract or two for a possible home run. If you hold just a single contract, trail a stop so that you can profit from further weakness while ensuring that the possibility of an actual loss is remote. _______ FURTHER UPDATE (February 4, 12:36 p.m. EST): The futures dipped no lower than 12005 overnight before this nasty little ferret lunged for the ankles of shorts. The rabid price action that has followed this morning took the futures as high as 12053 and as low as 1198o, all signifying nothing in particular. We’ll continue to short this and other index vehicles at every promising Hidden Pivot top simply because we can do so with little or no risk. In fact, and as you will have surmised, we can often make a small profit even when we have guessed “wrong.”
