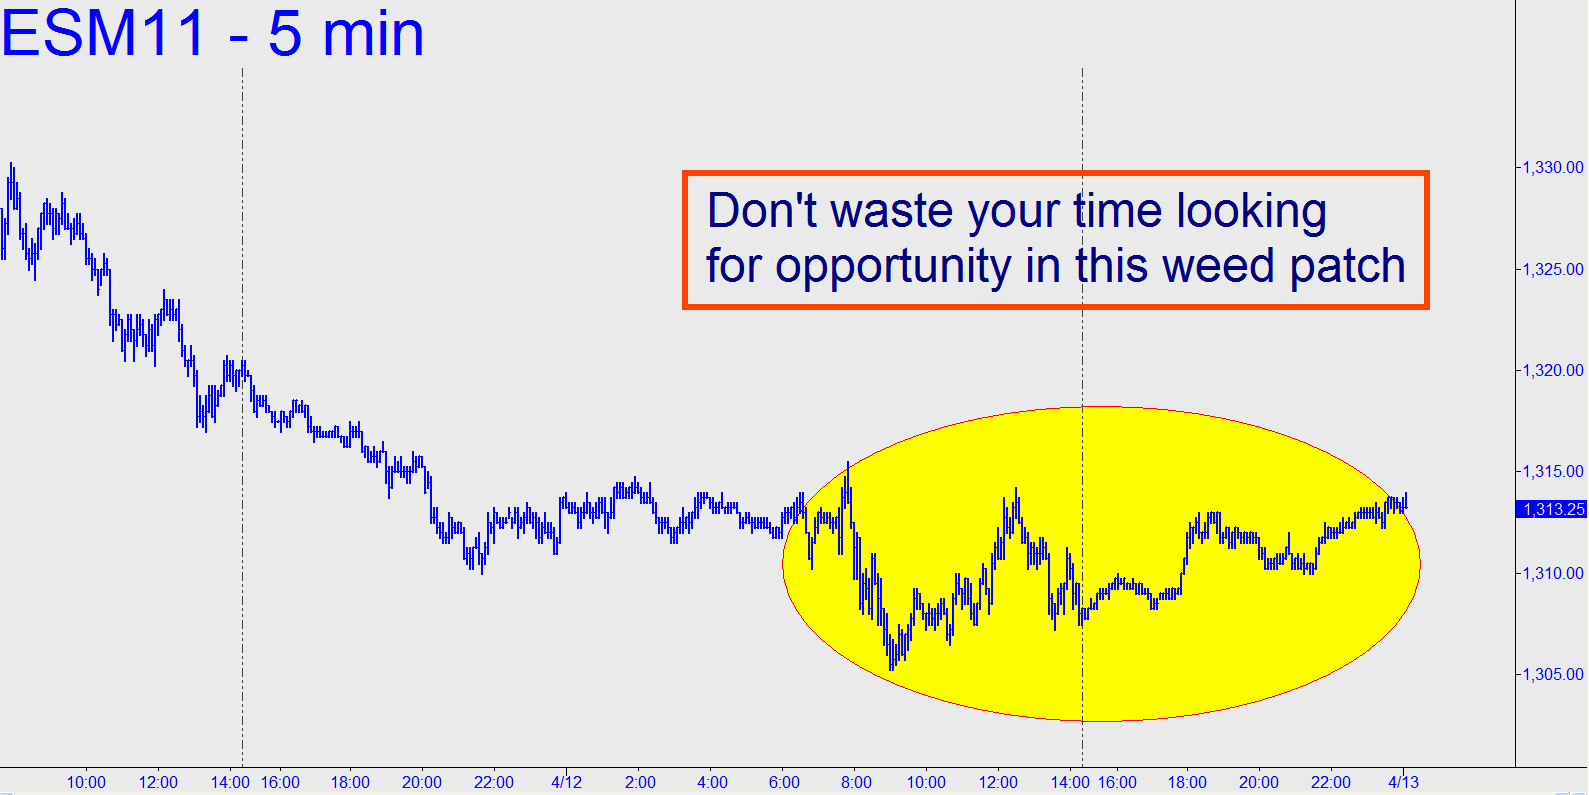
 Steady but mild weakness obtained yesterday, but so far tonight the action has been all about half-hearted short-covering. This has yet to produce an impulse leg on the 15 minute chart, let alone the hourly, suggesting that the better opportunity on Wednesday may lie in selling the rallies rather than buying the dips. As of around 2 a.m. EDT, however, there were no compelling targets to attempt it.
