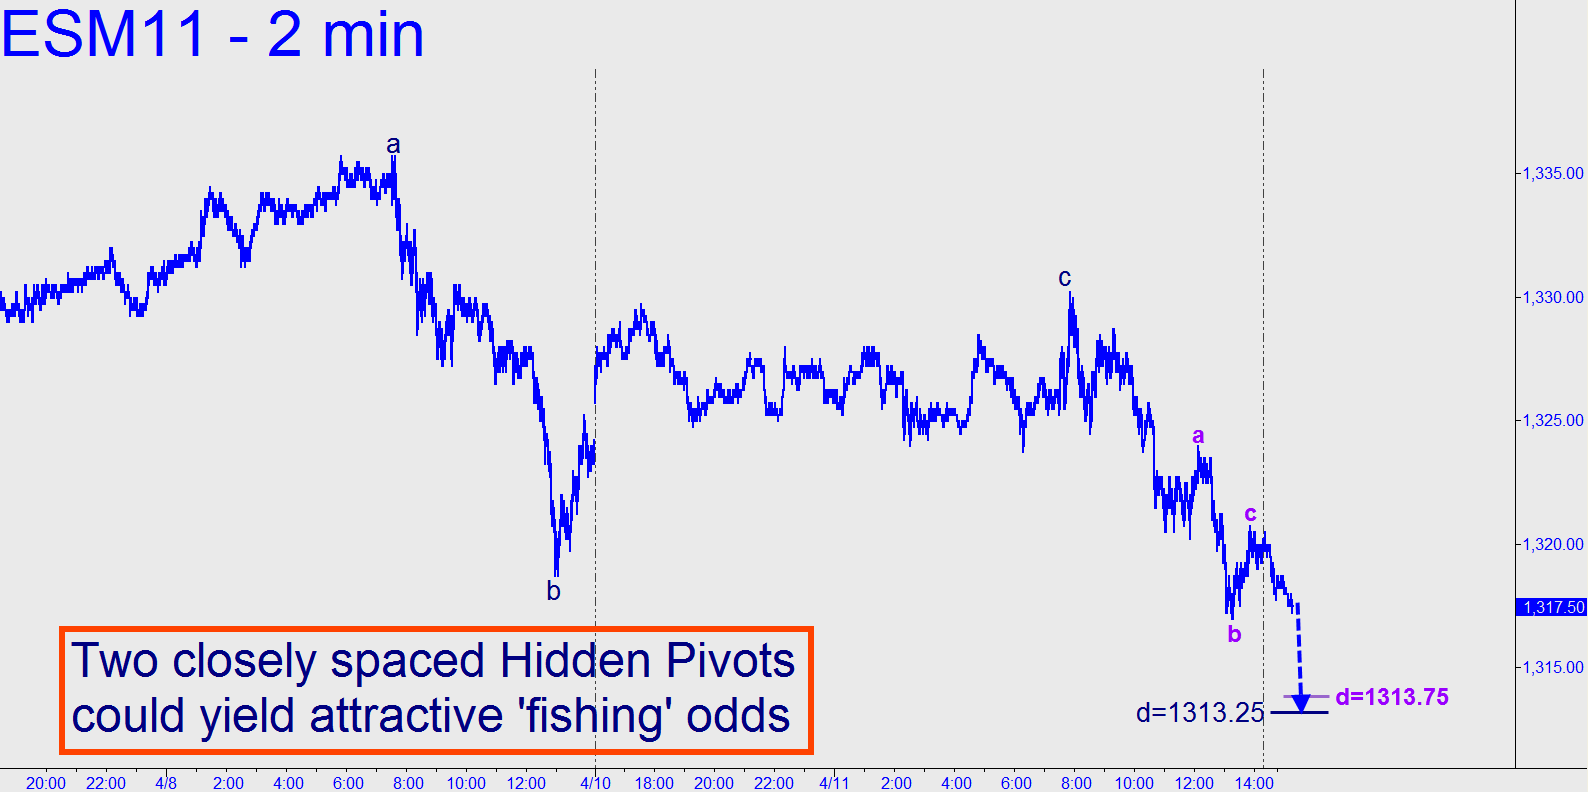
 Two pivots just below the floor of Monday’s modest damage suggest that bottom-fishing could be attempted with relatively little risk. The hidden supports lie, respectively, at 1313.75 and 1313.25, so I’ll advise bidding 1313.75 with a 1.00-point stop-loss. Looking at a somewhat bigger picture, there is nothing to say — at least, nothing that would allow for anything so bold or presumptuous as a trend forecast. The futures have been flatlining for two weeks, unable thus far to push above either hidden or structural resistances near 1337. 1.00_______ UPDATE (10:28 p.m. EDT): A 1313.75 low held tonight for more than an hour, but the feeble, 2.25-point bounce that ensued was not quite sufficient to “cover” the 1.00-point stop-loss we used to initiate the position. Our theoretical loss was $50, but we’ve at least determined that there is probably more weakness to come.
