The futu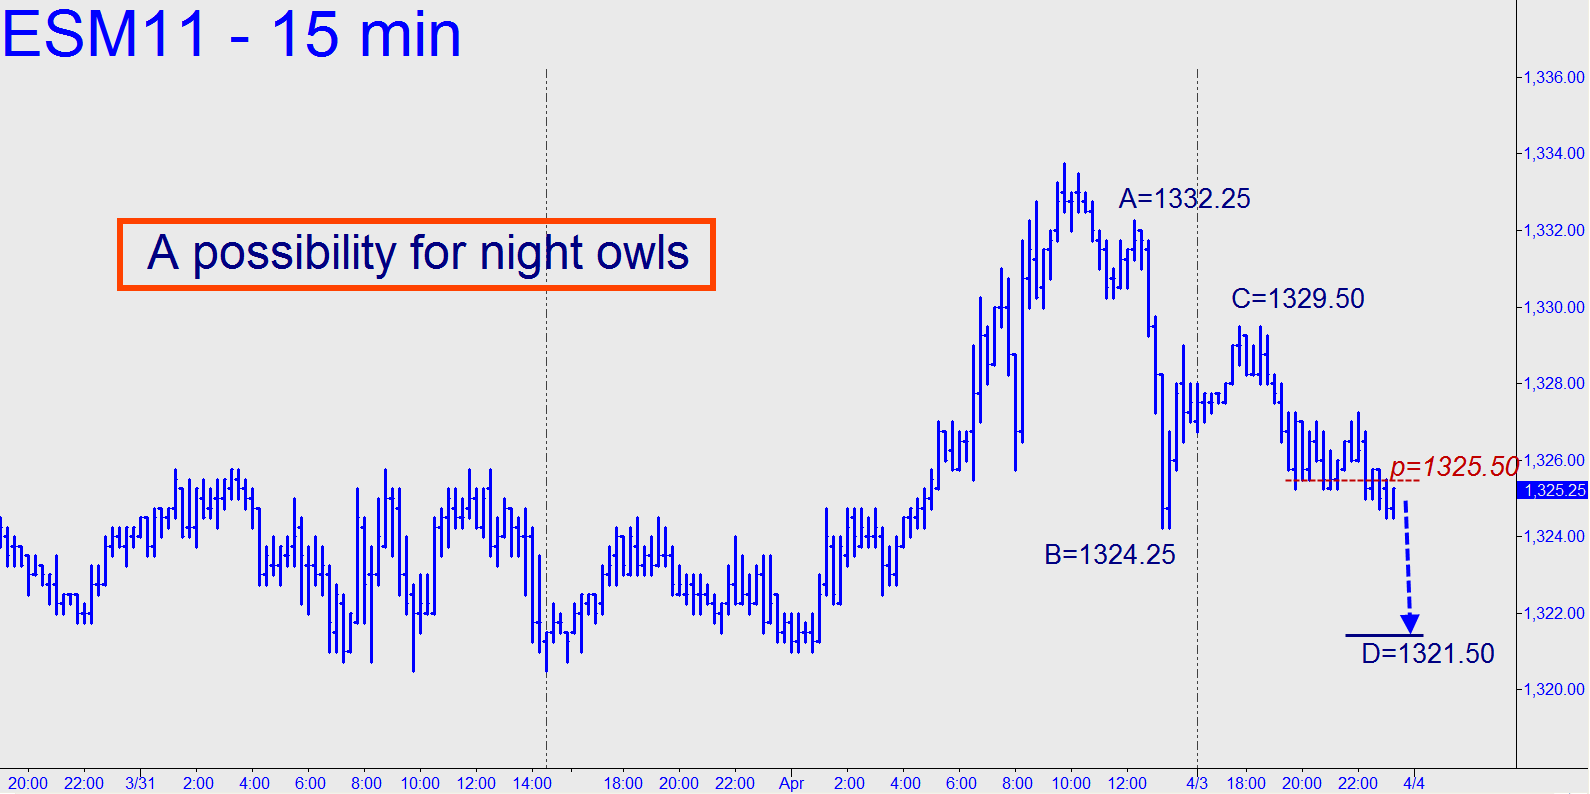 res appear too aware of mid-February’s 1337.75 peak to yield a by-the-numbers short at either of two Hidden Pivots lying slightly below it. I wouldn’t mind attempting the short with camouflage if buyers pop this vehicle above that peak, but it’ll be a game of cat-and-mouse otherwise, particularly if we are intent, as we should be, on holding theoretical risk to an absolute minimum. One way we could attempt to wade into the trade would be to try and get long for the last-gasp rally that is possible here. Most immediately, that would imply bidding down near the 1321.50 ‘d’ correction target shown in the chart. This is a so-so opportunity because of the too-obvious structural lows etched into the pattern on Friday, but if you’re game, use a 1321.75 bid with a 1.00-point stop-loss.
