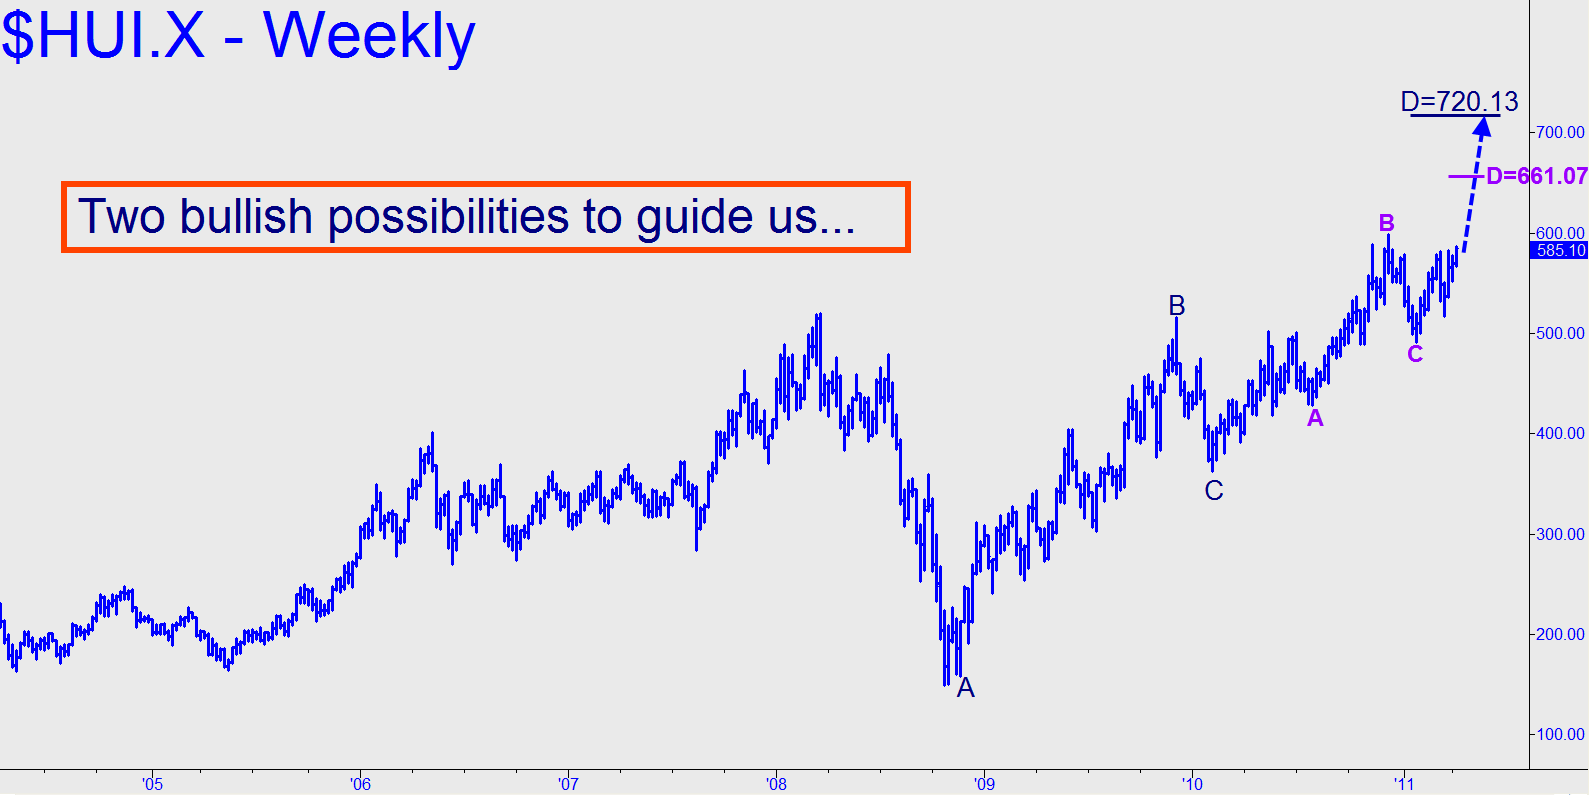
 An inquiry in the chat room yesterday concerning the outlook for this vehicle sent me to the weekly chart, which shows two patterns projecting, respectively, to 661.07 and 720.13. Notice in the chart (inset) that the “sausage” peak recorded in December at 516 necessitates the use of the one-off ‘A’. The larger pattern yields a 541.69 midpoint; the smaller, a resistance at 576.55. Both numbers should be held in mind as possible buying opportunities on a pullback. I’ve set a screen alert, but so should you — and I’d also be grateful for a nudge in the chat room, since I don’t track this vehicle very closely.
