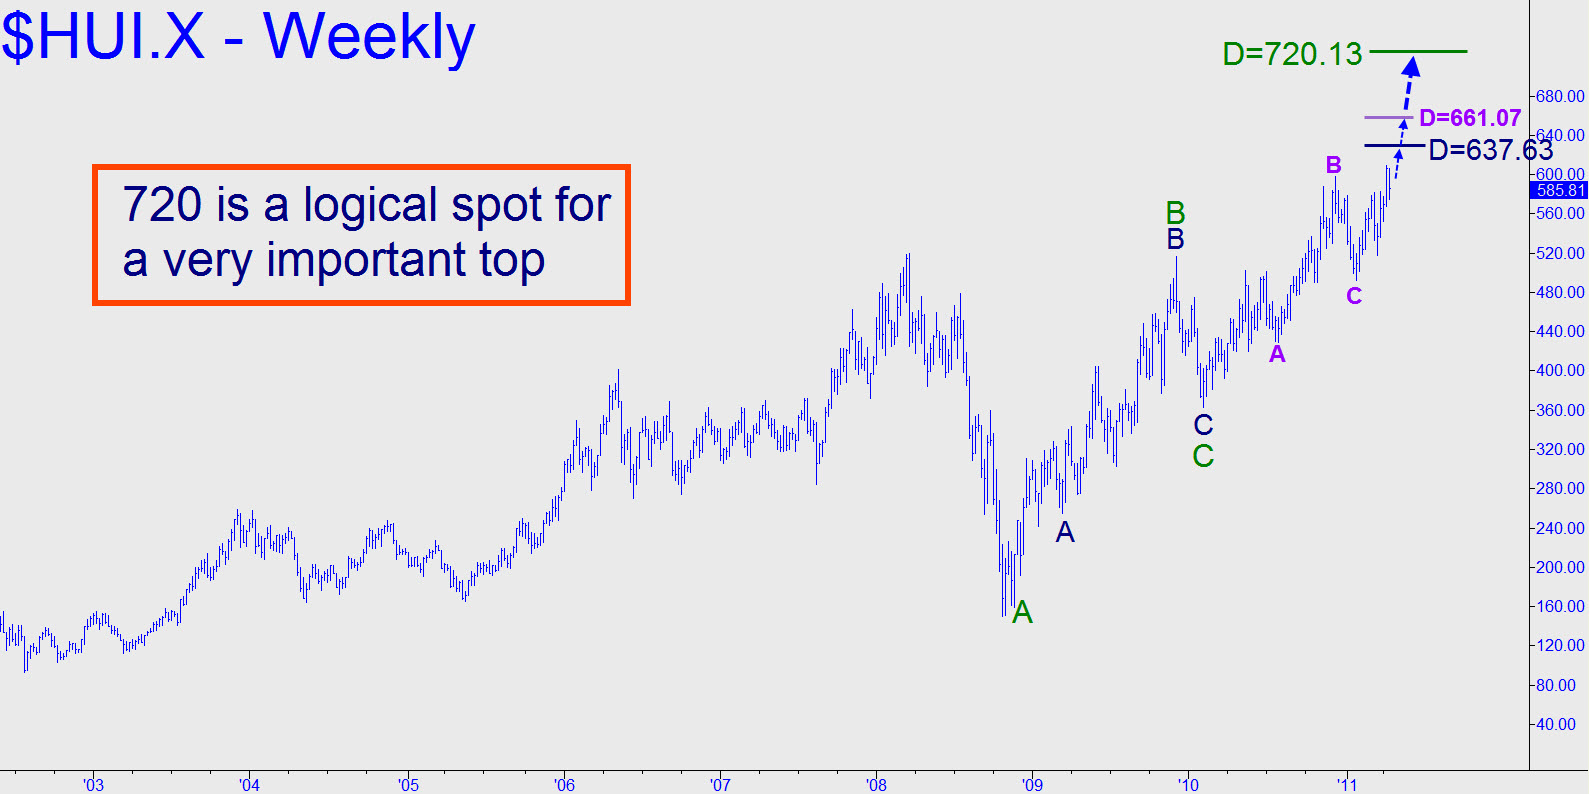
 The weekly charge suggests clear sailing to at least 637.63, a Hidden Pivot that looks persuasive on the weekly chart (see inset). If it is decisively exceed (i.e., buy more that $3 or so), however, a potentially more important target well above that price would be in play: 720.13, a key number identified here earlier. That’s where the weekly chart maxes out, so it is a logical place to infer a bull market top. There is one other resistance worth mentioning — a Hidden Pivot of lesser degree at 661.07 whose provenance is shown in the chart.
