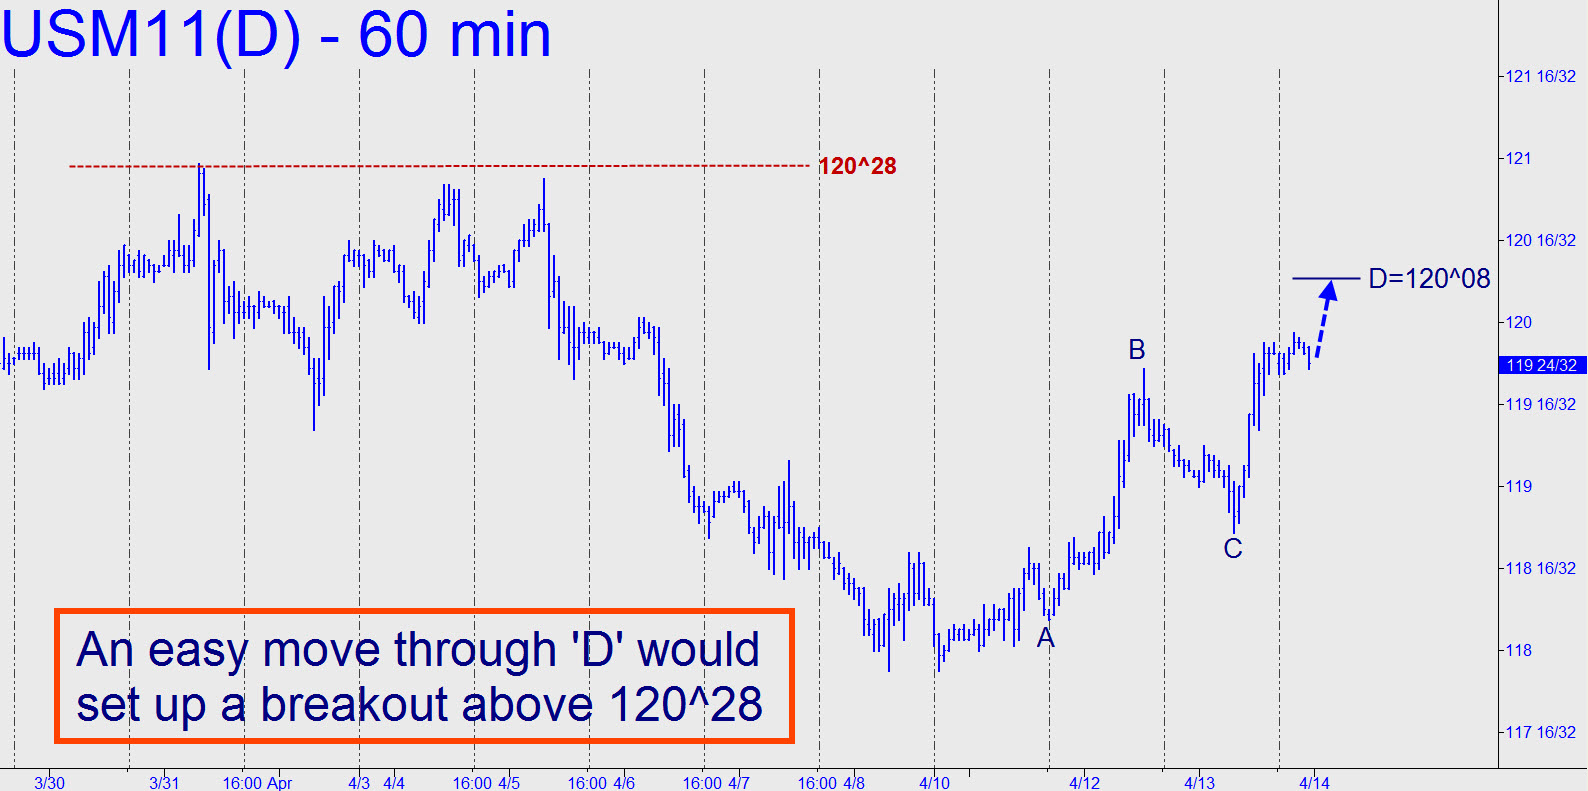
 I continue to view this rally as a potential barn-burner, although I am clueless as to what might possibly drive it moonward. On the basis of technicals alone, however, we were able to nail the recent low at 117^28 within three ticks. The rally that has ensued is promising, although the first significant pocket of resistance has yet to be hit. It lies near 120^28, but the futures will first need to conquer a lesser resistance, a Hidden Pivot rally target at 120^08. An easy move through that number would portend a breakout above 120^28.
