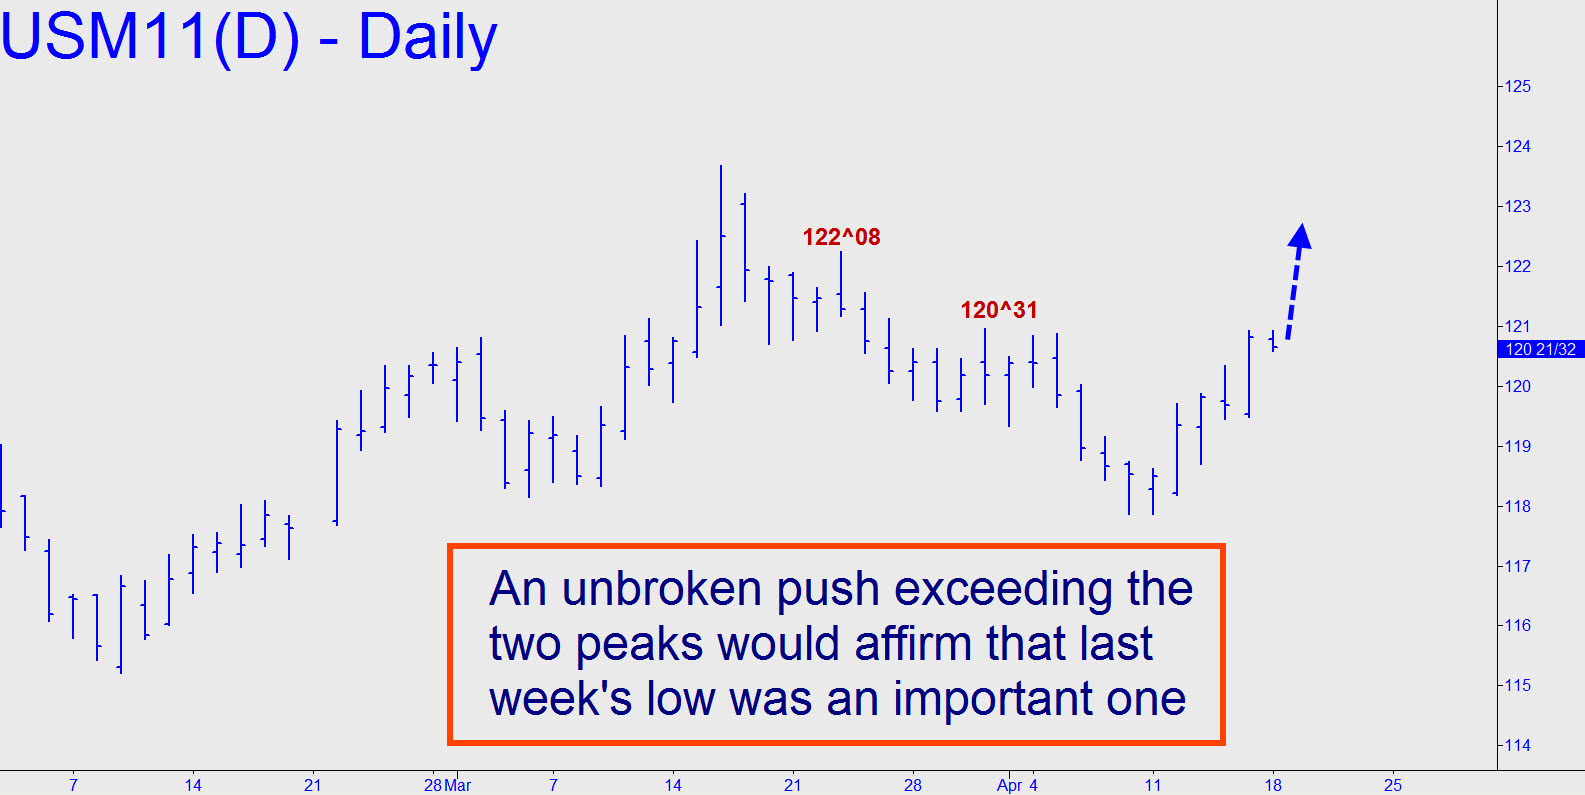
 It wouldn’t take much of a rally to create a bullish impulse leg of daily-chart degree, shortening the odds of an eventual push to as high as 126^11 over the next four to six weeks. Specifically, if the futures exceed March 31’s peak at 120^31 and then continue higher, surpassing 122^08 without a significant retracement, that would strongly imply that last week’s low at 117^28 was an important one.
