
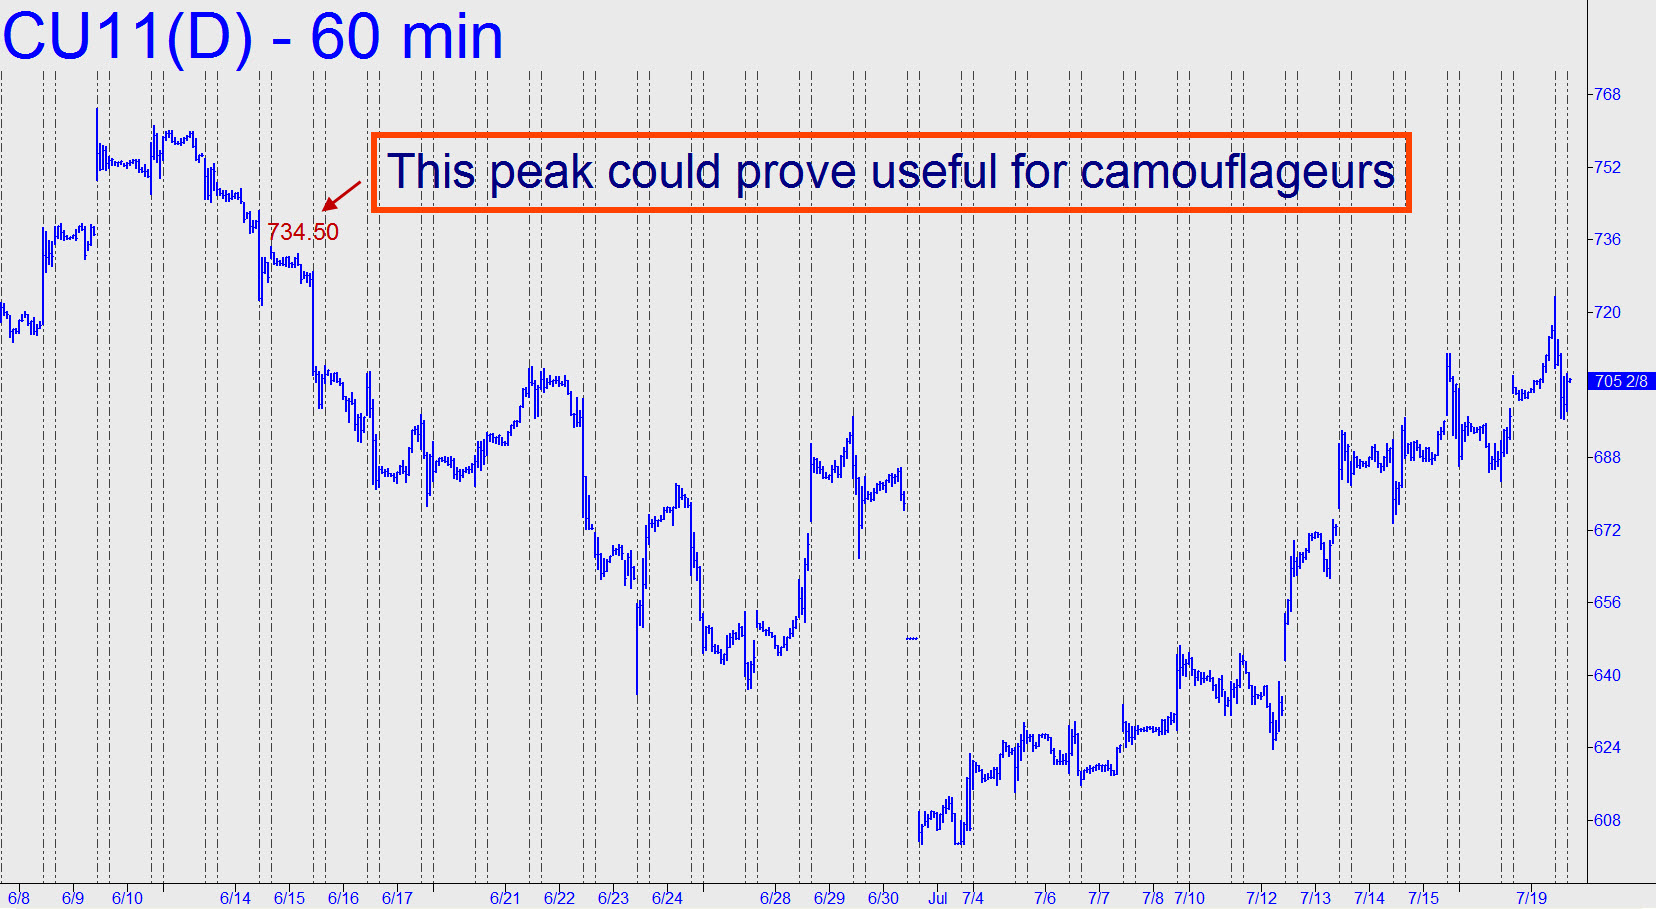
 Here’s a hot tip I’ve received on Corn from a source that has been nicely ahead of some big commodity moves: “Do not ignore this trade,” he advised in an urgent e-mail message. “It’s gonna make a ‘sugar move.’ ” As you may already have surmised, the source called sugar’s explosive rally almost to-the-day. Nonetheless, I’m going to downplay the hot-tip aspect here and simply focus on Corn by-the-numbers. My goal is to allow you to test the water without suffering much damage if the tip doesn’t pan out. However, if you’re eager to play and cannot wait for such perfect opportunities as I might hope to identify, then by all means take your best shot using camouflage.
For the moment, however, I’ll suggest zooming no lower than the five-minute chart to secure a cheap boarding pass. The look-to-the-left peak I’ve identified at 734.50 would be ideal for such a purpose, assuming it is exceeded by just a tick or two before giving way to a fleeting b-c correction. Do not take this trade, however, if you cannot identify the point ‘A’ of the larger, bullish pattern on which our ‘camo’ entry would be based. (Hint: It occurred months ago but can still be found in the hourly chart.) Remember, the best camouflage entry spots are signaled on charts of a higher degree than the ones we actually use to get long or short. One final note: My source is playing the December contract on speculation that a crop bust this fall will trigger an explosive move.