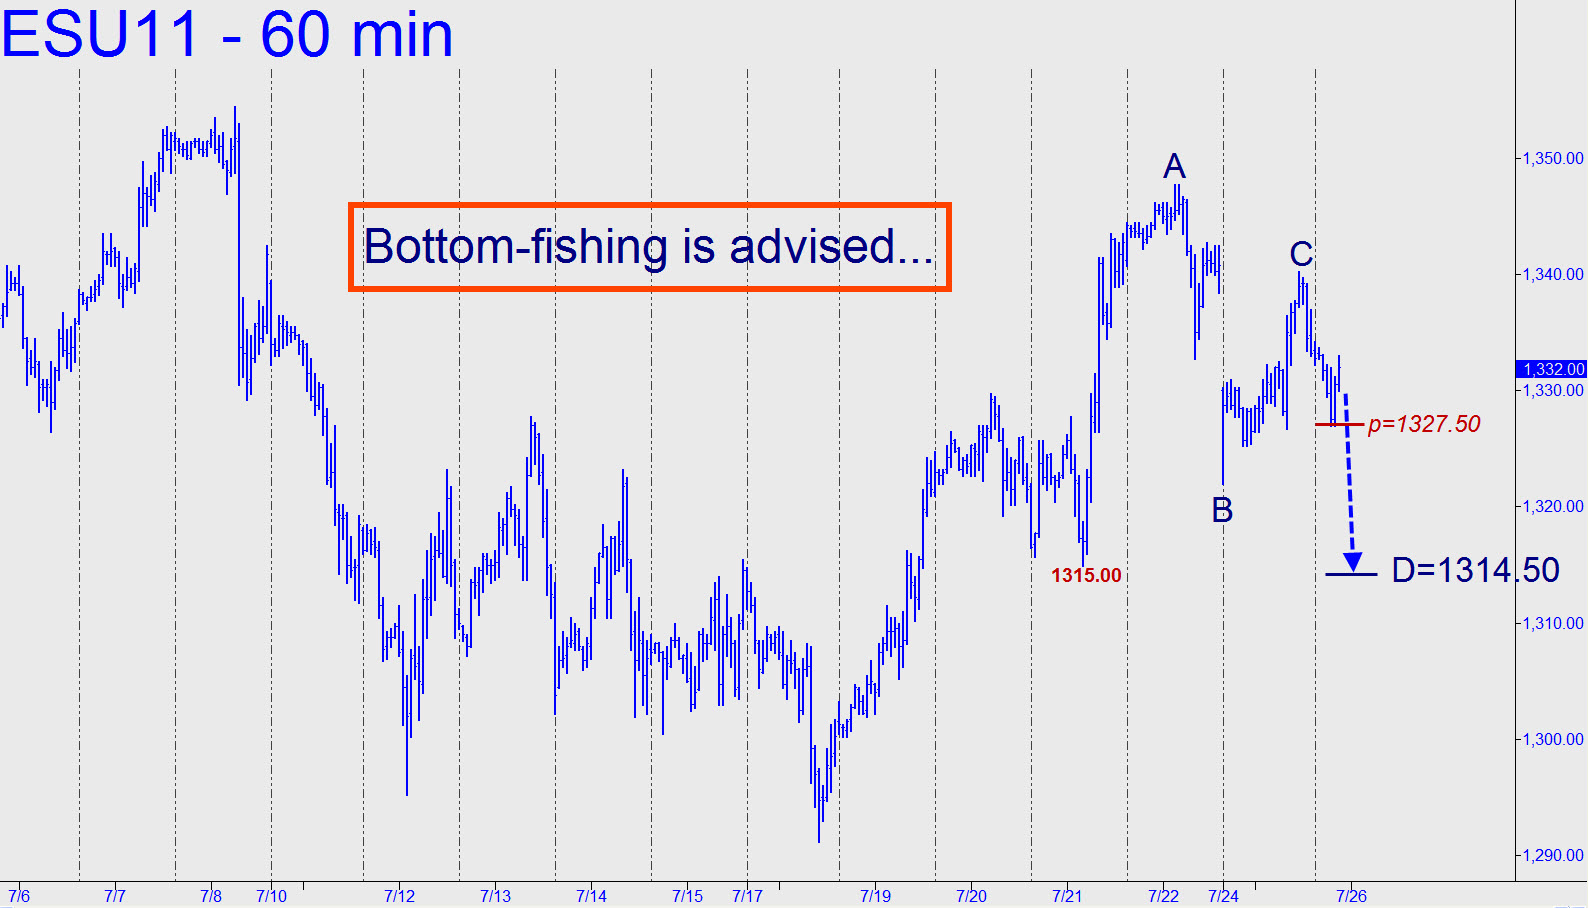
 We’ll see how much pluck buyers have if the futures fall beneath 1327.25, a midpoint support shown in the chart. Its ‘D’ sibling lies at 1314.50, and that would become my minimum downside objective if the midpoint gives way. (So far, it has been exceeded by just a single tick.) That last number is nearly coincident with a 1315.00 low recorded last Thursday, but it can be bottom-fished nonetheless with a 1314.25 bid, stop 1313.25. I am suggesting that you bid slightly below the actual pivot on expectations that a breach of the 1315.00 low will stop out enough traders to send the futures more than just a tick beneath the low. Camouflageurs can avoid having to deal with this uncertainty by simply buying the first abcd upturn from near ‘D’.
