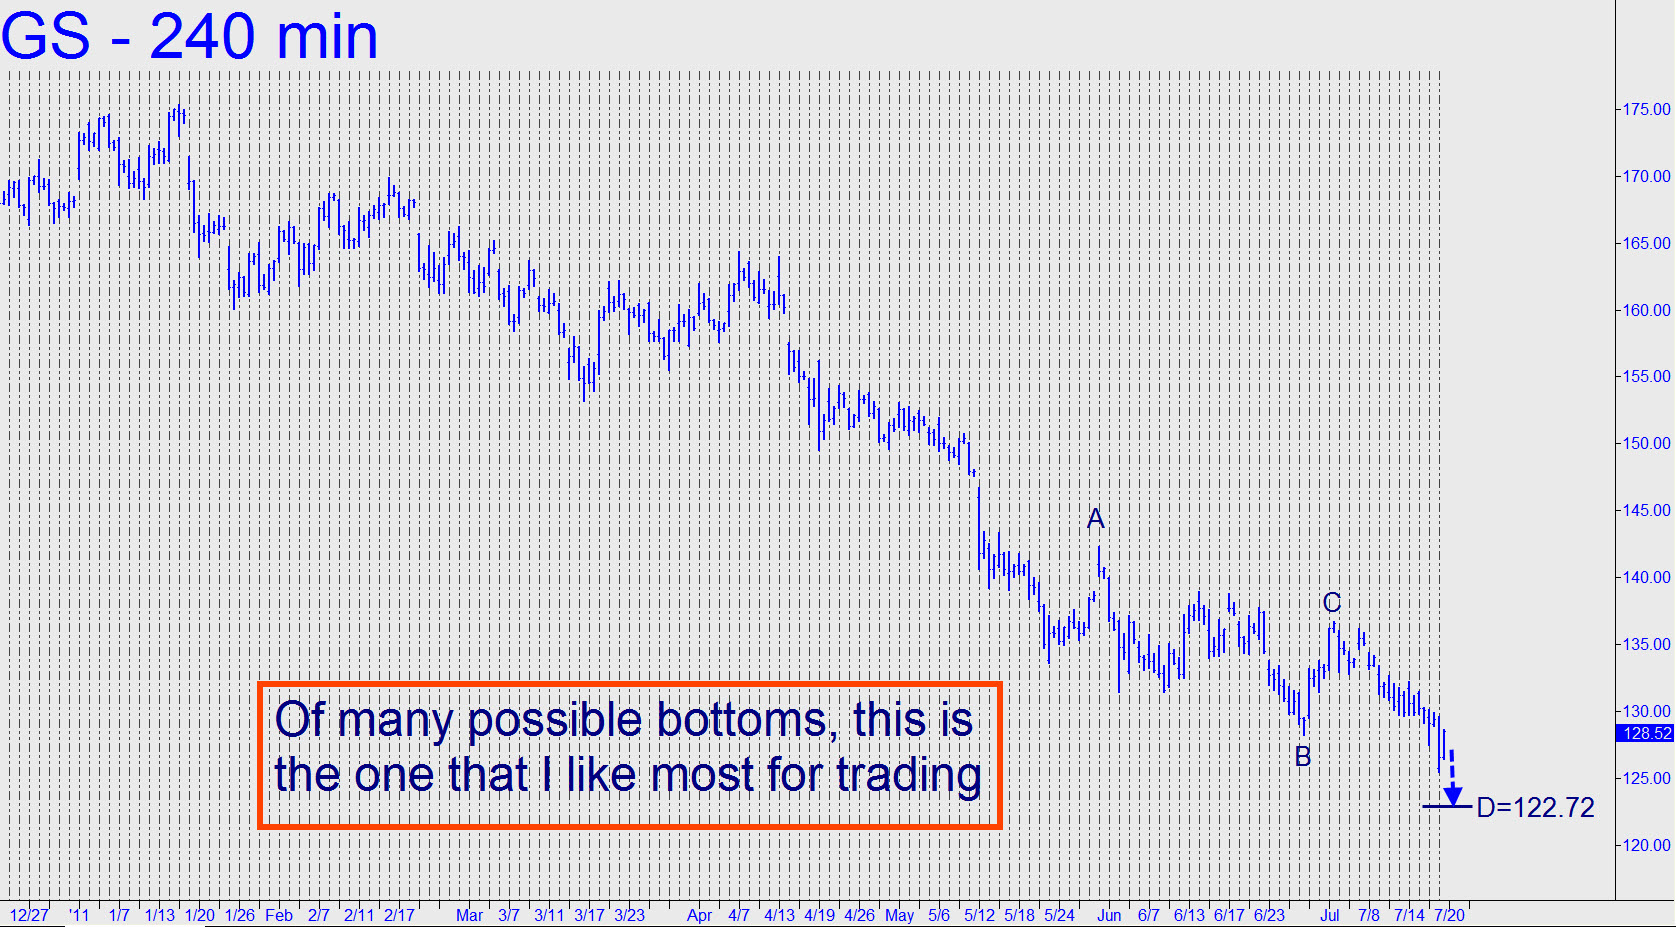
 In the chat room yesterday, a longtime subscriber said he liked the risk:reward for bottom-fishing in Goldman shares right now. I’ll suggest holding off until GS hits the 122.72 Hidden Pivot target shown in the chart. If it happens within the next two weeks, you should buy two September 125 calls. Since there are so many ABC patterns that could produce alternative lows, however, I won’t stand in the way of camouflageurs diligent enough to look for the turn from current levels on down. _______ UPDATE (9:59 a.m. EDT): The rally from yesterday’s heavily manipulated, gap-down low looks like a distributive fraud to me because the initial run-up failed to exceed a modest shelf of supply created during the final two hours of Monday’s session. Although the stock has finally lifted above that shelf this morning, it is revealing underlying weakness in having failed to do so on the first attempt. _______FURTHER UPDATE (early Thursday): The stock came at shorts with a vengeance yesterday, but it will need to push above the May 31 peak at 142.30 before we’re obliged to give it any respect. Since that is not inconceivable, camouflageurs are advised to look on the 15-minute chart for opportunities to get long. ______ FINAL UPDATE for now (July 26, 12:30 p.m. EDT): We’ll put this gambit aside, reminding ourselves from time to time that when the deft mechanics who control this stock have shorts by the cahones, they don’t let go.
