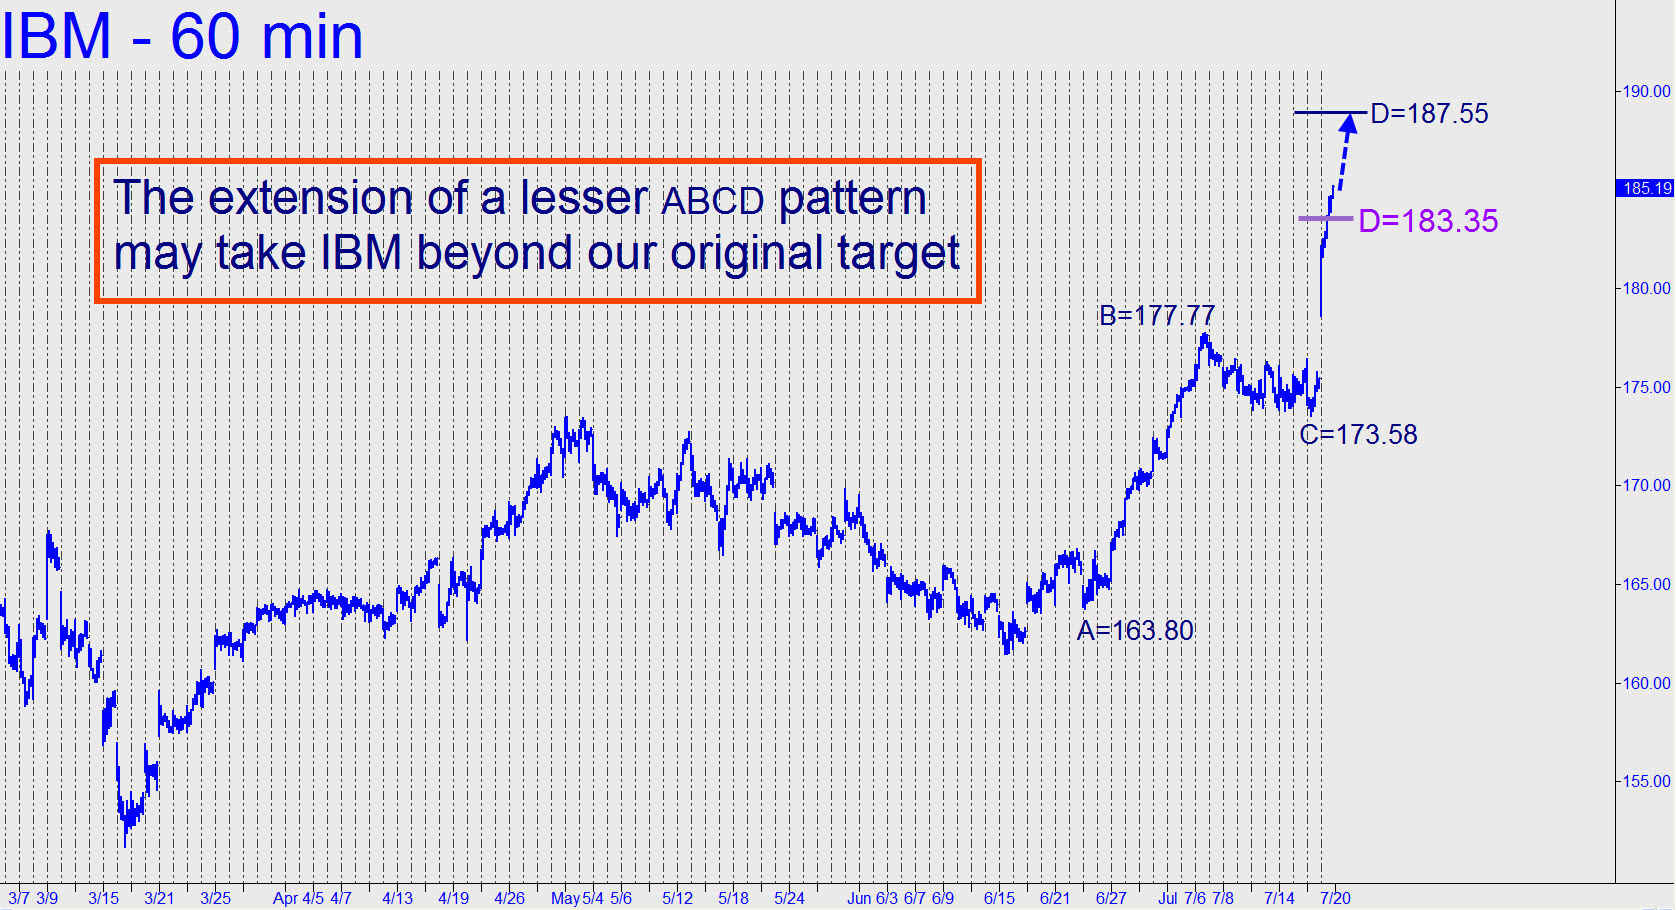
 We hold two August 175 puts acquired for 1.20 near the so-far top of one of the most manic rallies in this stock’s illustrious history. This is a speculative play, akin to yelling “Stop!” as a speeding freight train bears down on us. That said, the pattern that produced the target we’ve shorted is sufficiently compelling to suggest we’re aboard near ‘a’ top if not ‘the’ top. Do nothing further for now but stay tuned, since we’ll want to short some puts of a lower strike against the ones we own if the stock corrects sharply. Please note as well that 187.55 is possible before the stock turns lower. That is the ‘D’ target of a pattern less significant than the one yielding the original one at 183.35 (see chart), and its attainment would represent a minor-trend extension of a major trend as sometimes occurs. _____ UPDATE (12:12 p.m. EDT): With IBM getting butchered today off the bull-trap high it achieved Sunday night on word of a budget “deal,” I’ll recommend shorting an August 170 put at-the-market for each August 175 put you hold. This will give us a $5 vertical put spread for nothing, or close to it.
