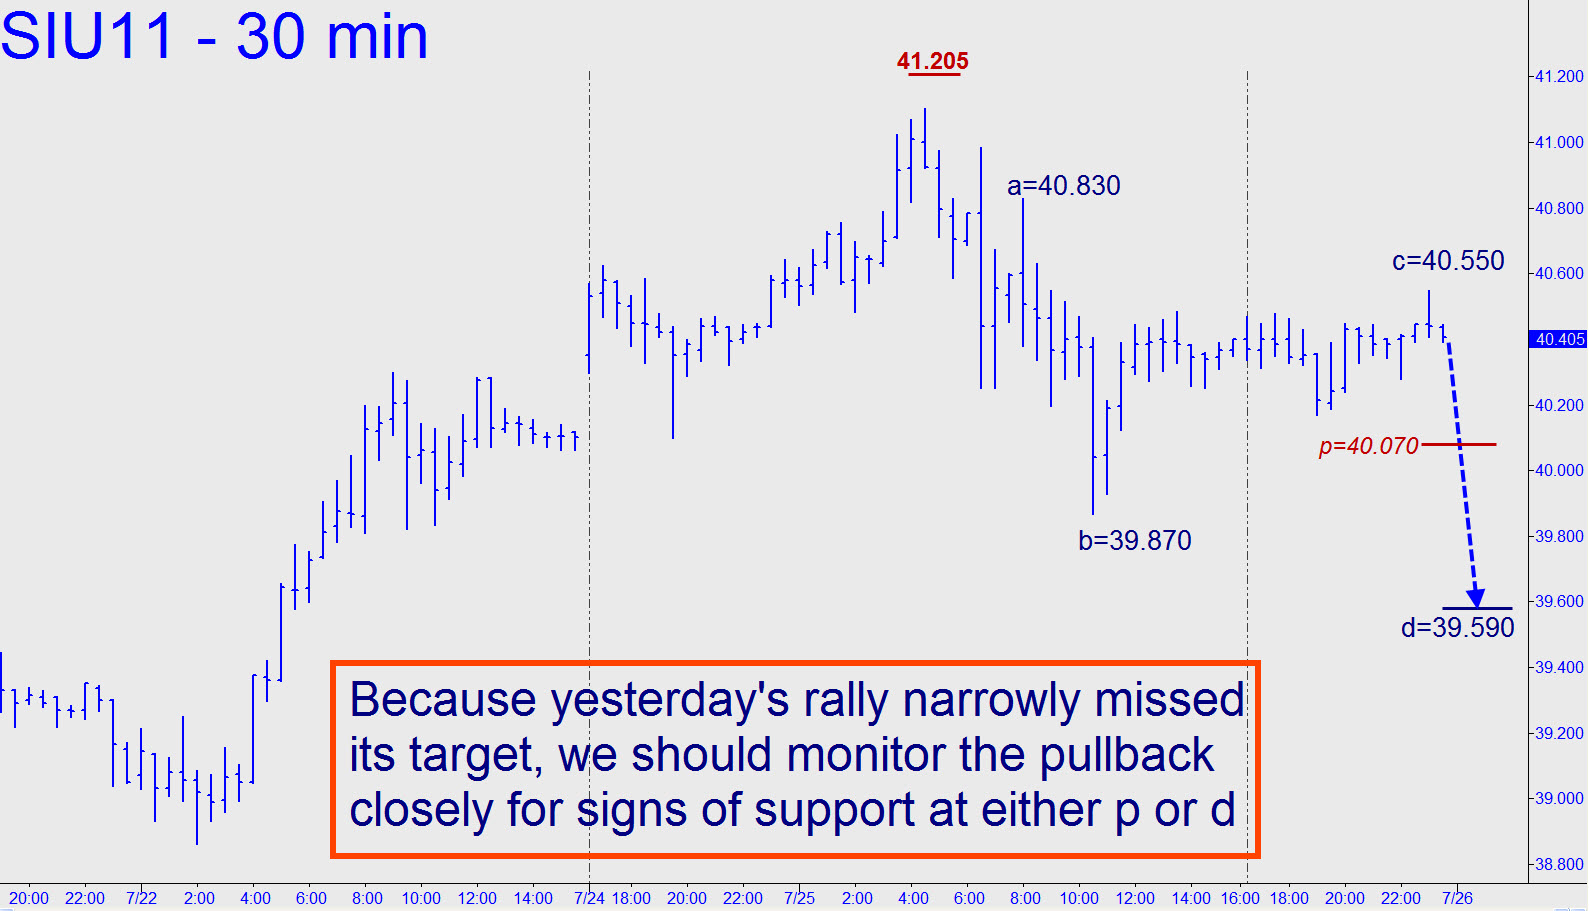
 After failing yesterday by a dime to reach a target I’d proffered at 41.25, the futures turned tail and created a bearish impulse leg on the 30-minute chart. This demands caution for now, although it wouldn’t be at all unusual for the futures to take things to the limit on the lesser charts before getting back in bullish gear. To judge sellers’ resolve, let’s use the ‘p’ midpoint and ‘d’ target of the corrective pattern shown. As always, a decisive breach of p would imply more weakness to the target; while a breach of the target itself could signal a bearish change in the intermediate-term trend. Because impulse legs are in a “duel” on the hourly chart, camouflage traders may have to zoom down to the very lesser charts to find opportunity.
