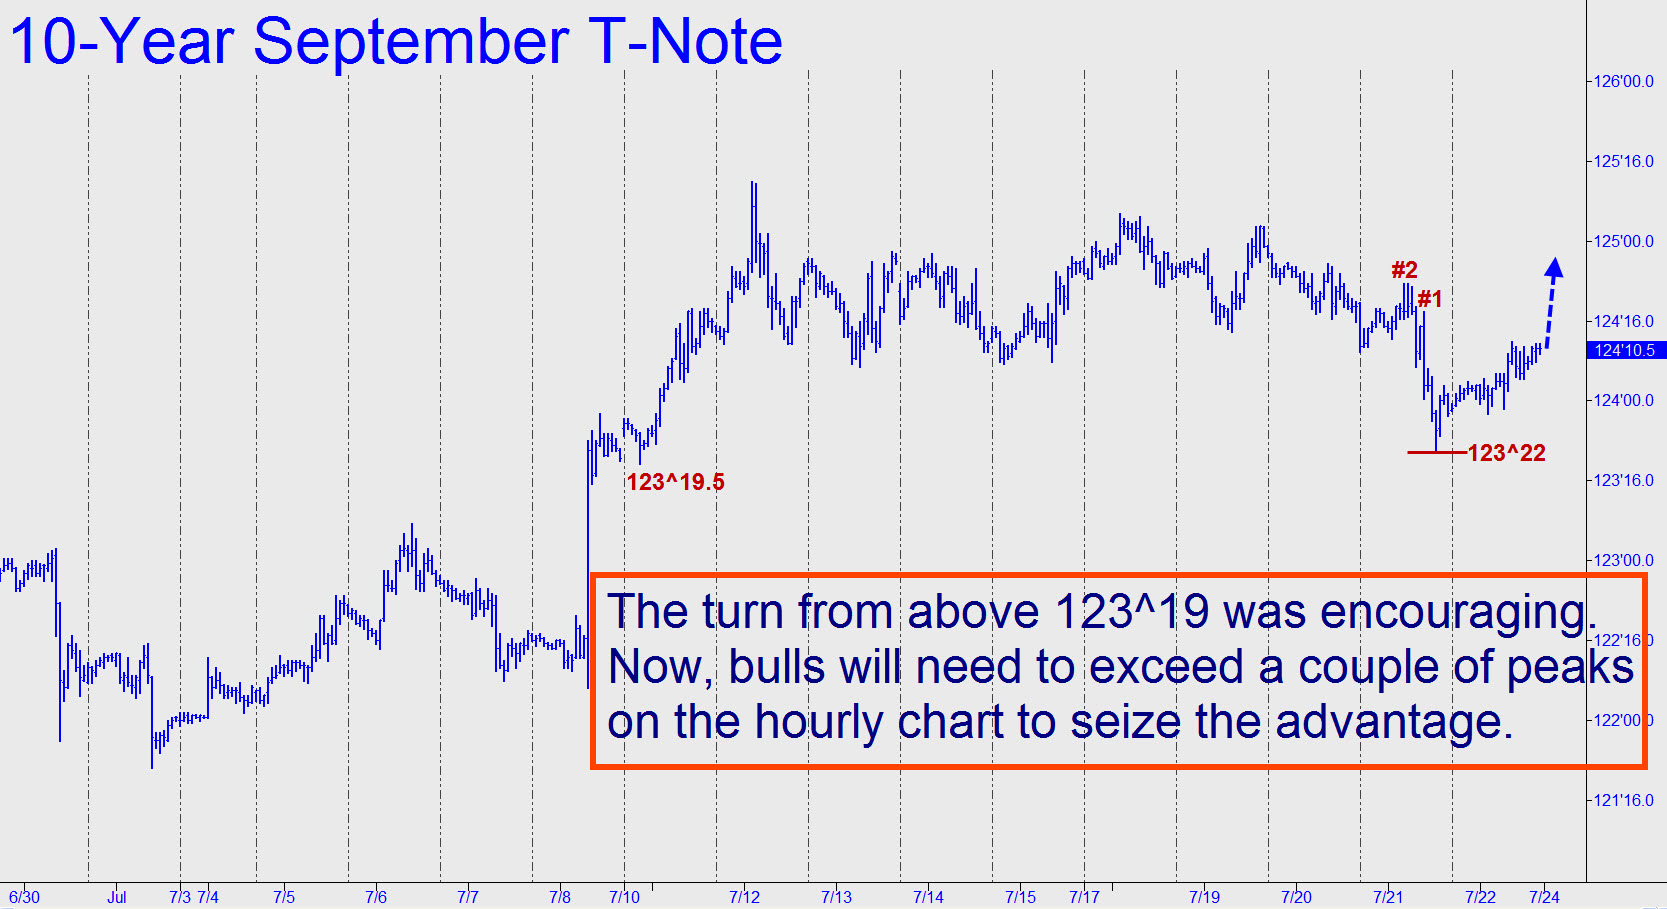
 The two-week swoon in late June/early July left a sinkhole in the chart that raises doubts about the long-term veracity of the bull. However, the failure of last Thursday’s plunge to take out a 123^19.5 structural support from July 10 is an encouraging sign. A shift toward bullishness would be further corroborated if the bounce from the recent low exceeds a couple of peaks (see chart) on the hourly chart without having tested the Hidden Pivot midpoint of the still-developing pattern shown. We await further evidence.
