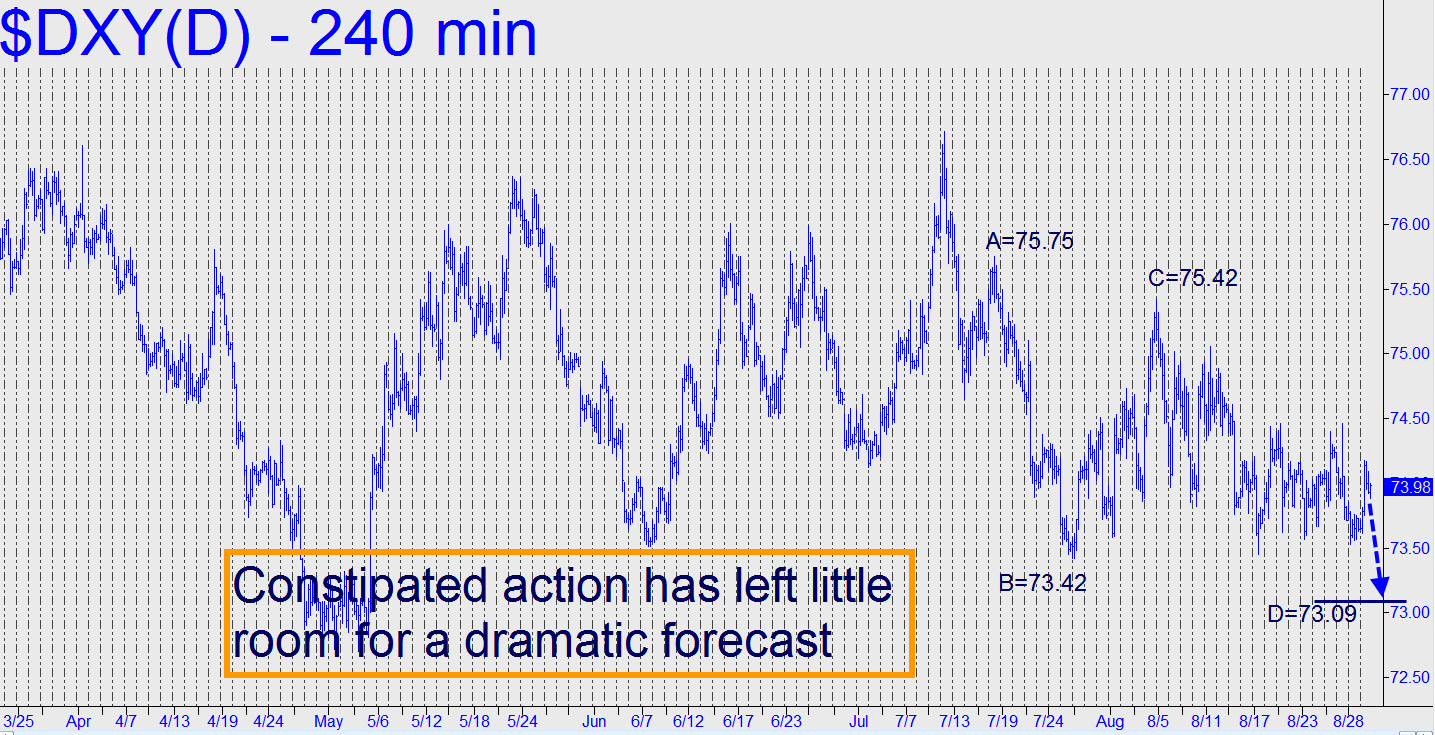
 I’d love to be able to say more about the dollar, but the medium-term charts have been constipated for months. Presumably, there are two supports being defended by the Powers That Be: early May’s lows, just beneath 73; and the Maginot Line at 70. From a Hidden Pivot standpoint, the downside looks no worse than 73.09 on the next bout of weakness (see chart). Alternatively, the futures would need to thrust above 75.75 to hint that something interesting was going on. My suggestion is to set an alert at these numbers — and to wake me if one or the other is hit.
