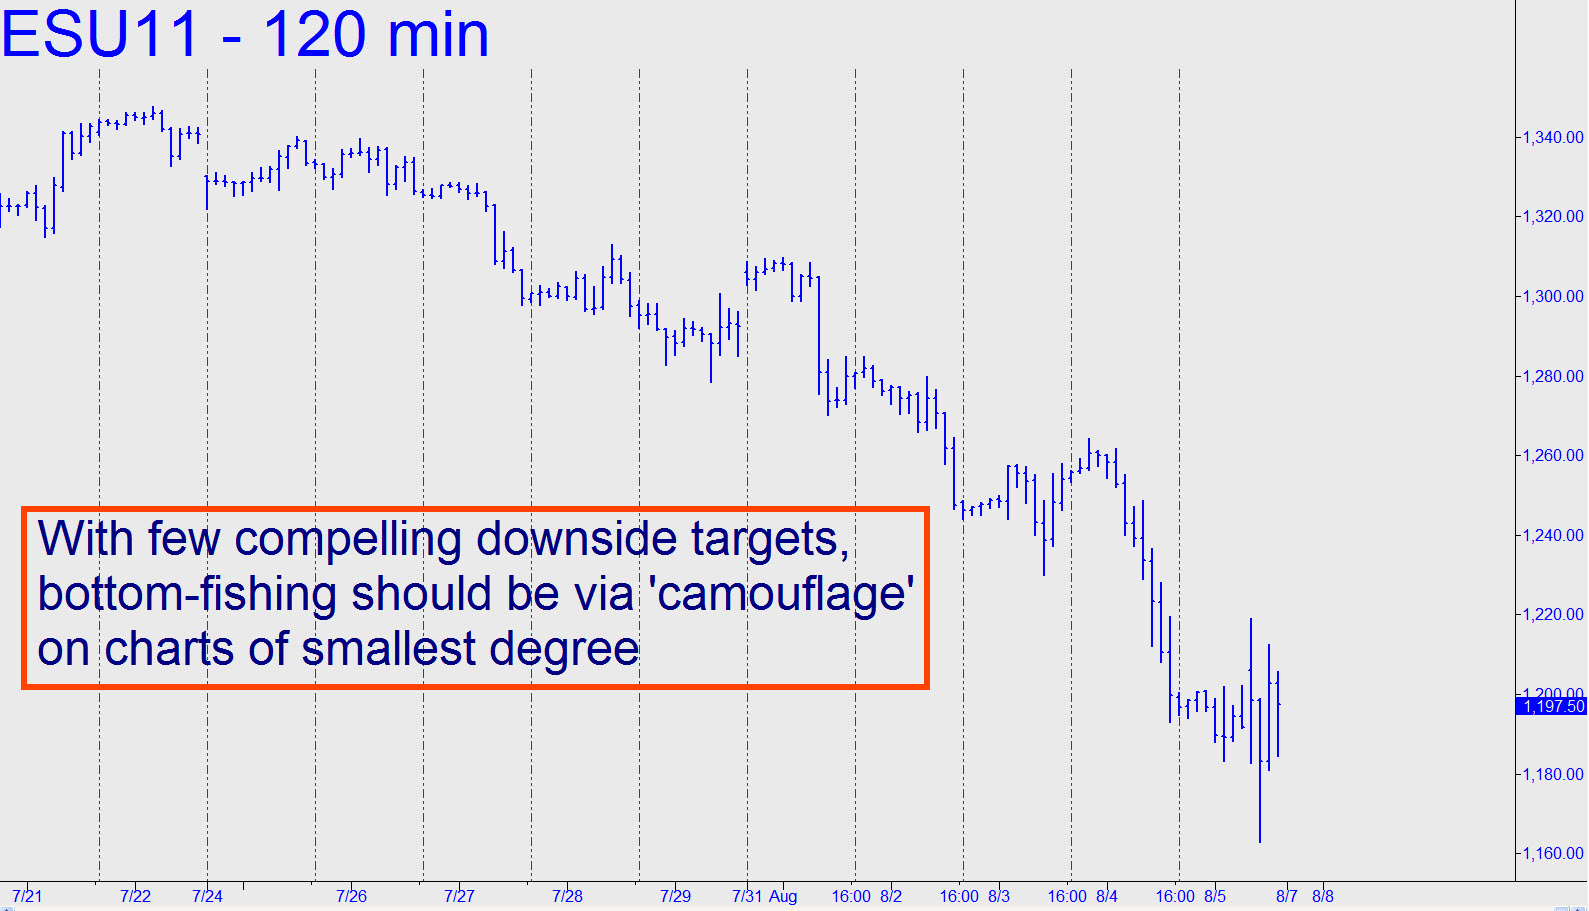
 Regardless of how high the futures bounce during what promises to be a memorable day, the lows will not avoid breaching a third external low on the daily chart that had been spared on Friday. We’ll have to be extremely careful hunting for a spot to get short when the impulse leg from the July 22 high corrects in B-C fashion. But most immediately, and for purposes of bottom-fishing, I’d suggest using the 140-minute chart to identify an intraday low ‘p’ or ‘d’ suitable for camouflage. There are no patterns or targets that are especially striking right now, but even the “bad” ones will do if your entry risk is allocated on the three-minute chart.
