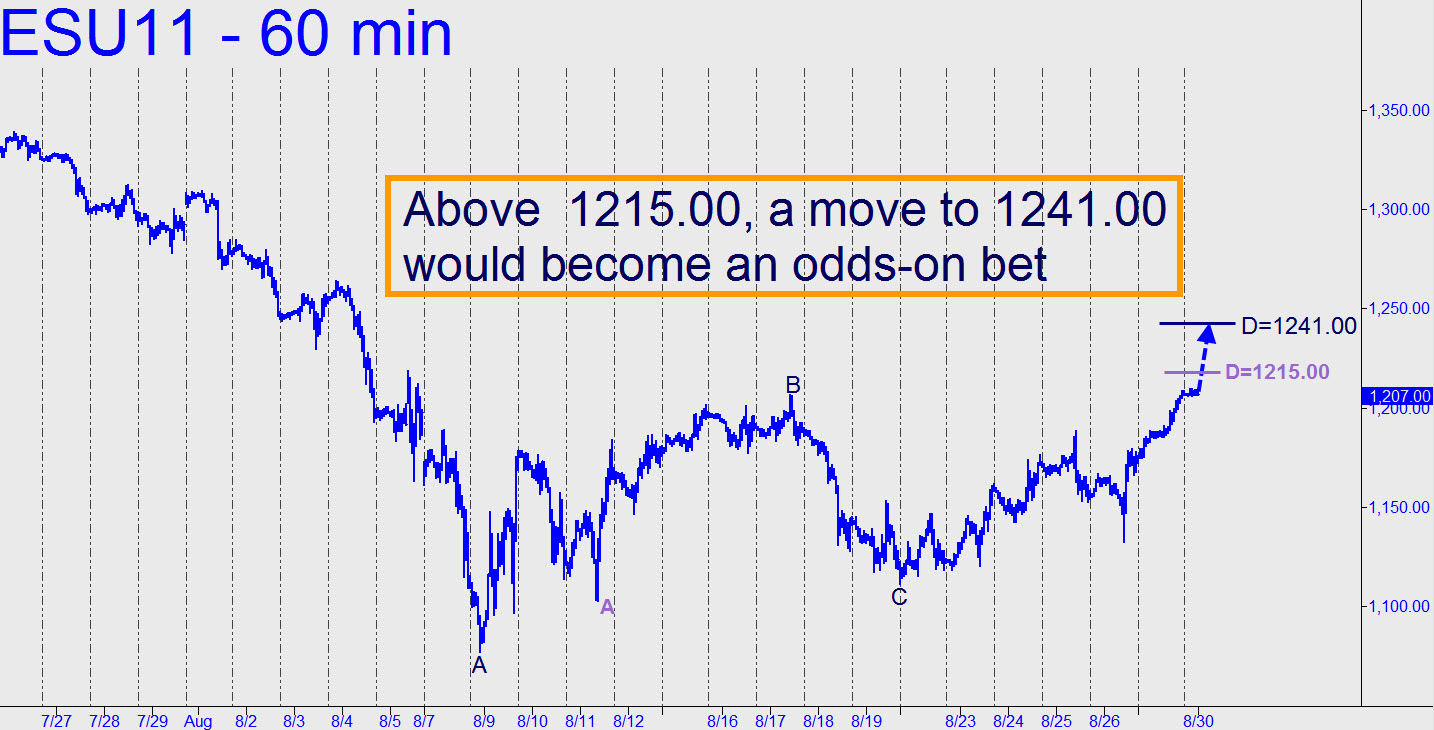
 Voracious buyers chomped through resistance near 1200 so easily yesterday that we can only infer the futures are headed for the 1241.00 target shown. Camouflage buying opportunities will be tough to find, considering the steepness of the rally, but if the future should pull back to the 1176.25 midpoint of our rally pattern, that’s where I would suggest looking. More immediately, the night session high at 1210.0o precisely equals a Hidden Pivot resistance derived from the hourly chart (A=1111.25 (8/21, 8:30 p.m.), B=1188.50, and C=1132.75) so any movement above it, even slight, would augur further progress toward 1241.00. That would be reason to seek out bull trades aggressively for the next 25 or so points. One caveat: a minor hidden resistance at 1215.00.
