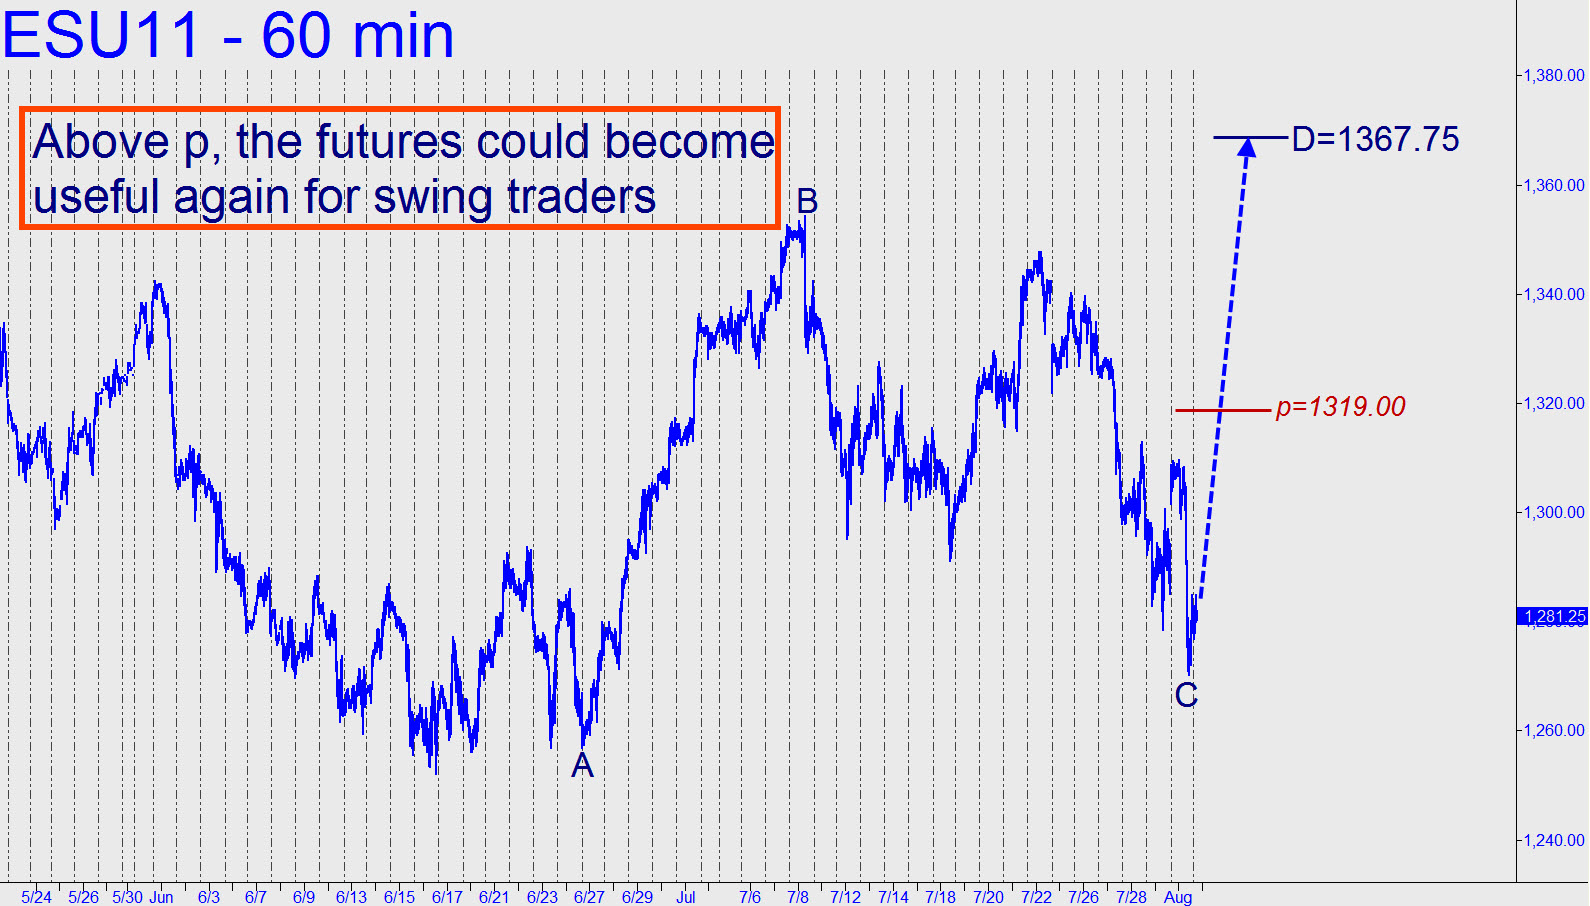
 Price action in this vehicle is for the nimble and sporting only, since the ups and downs of late have been too vicious to position-trade. Assuming yesterday’s low holds, the futures would become faintly interesting on the hourly chart once 1319.00 has been exceeded to the upside on a closing basis. That is a Hidden Pivot resistance associated with a ‘D’ rally target at 1367.75.
