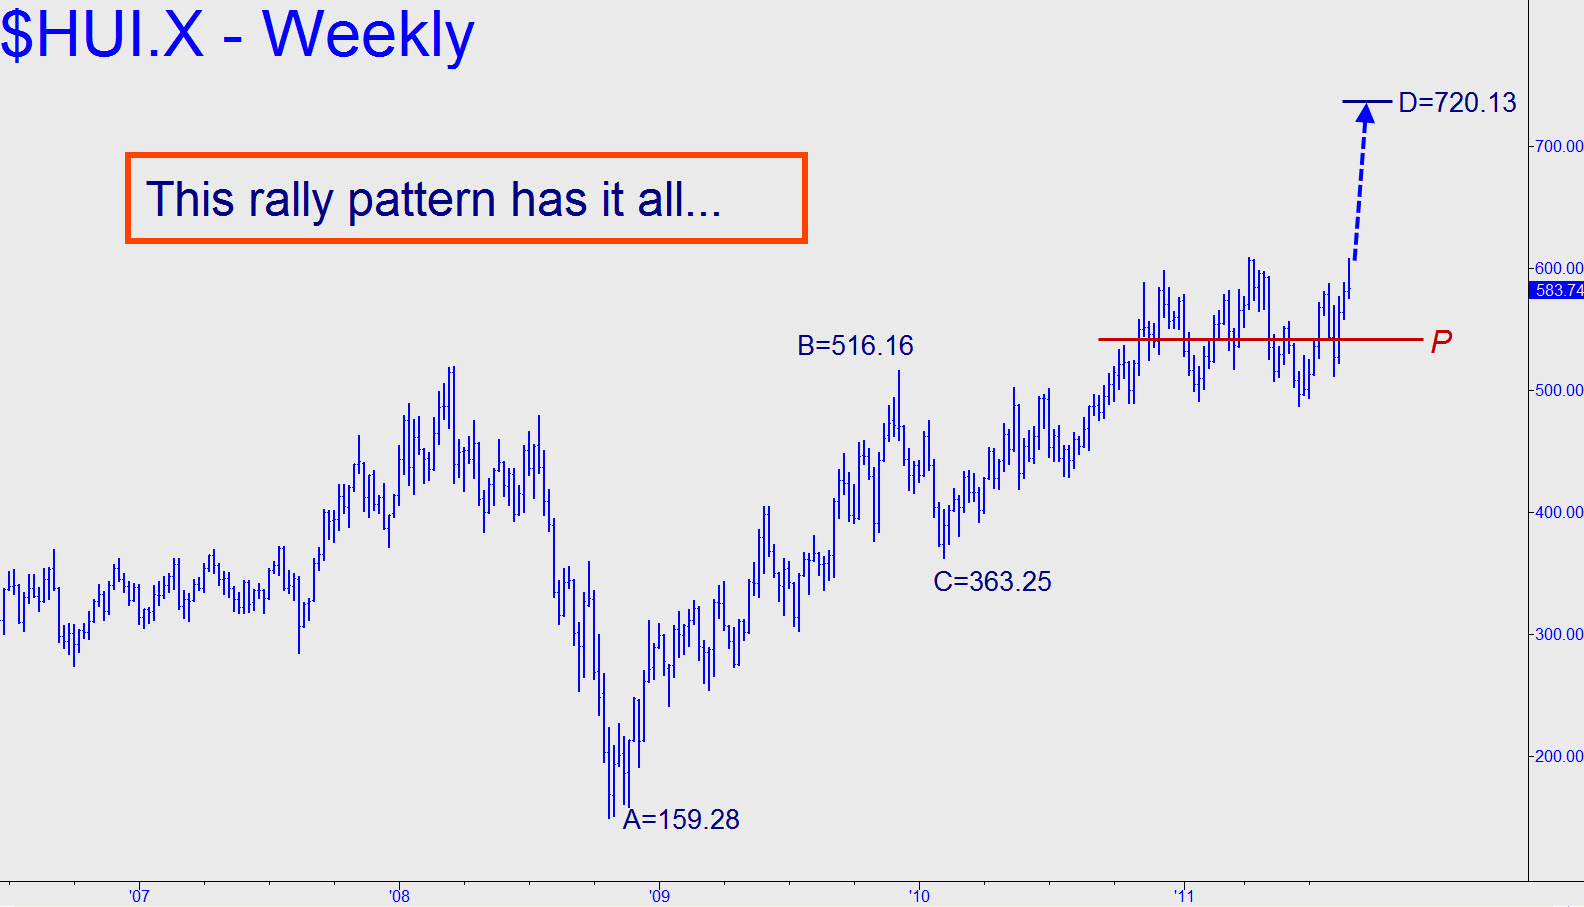
 Some rally targets slightly above 600 that I’d identified a while back have been achieved, so it’s time to stretch the bullish imagination once more. Notice in the weekly chart that a Hidden Pivot target at 720.13 holds so many charms for the astute Pivoteer, to wit: 1) a coy, one-off point ‘A’; 2) a spire-like ‘B’ that took on some daunting external peak as gracefully as the samurai who wields bamboo instead of steel; and, 3) single-bar coordinates at all three points that say “Hi there!” Nor should we fail to notice that the 541.69 midpoint pivot has been central to the oscillations of a presumptive accumulation that has been developing thrust for ten months. All we can ask for at this point is a feint just a few pips above last April’s 609.22 high, since any qualifying pullback from that number would set up an entry opportunity just as this vehicle is finally breaking free of its mooring.
