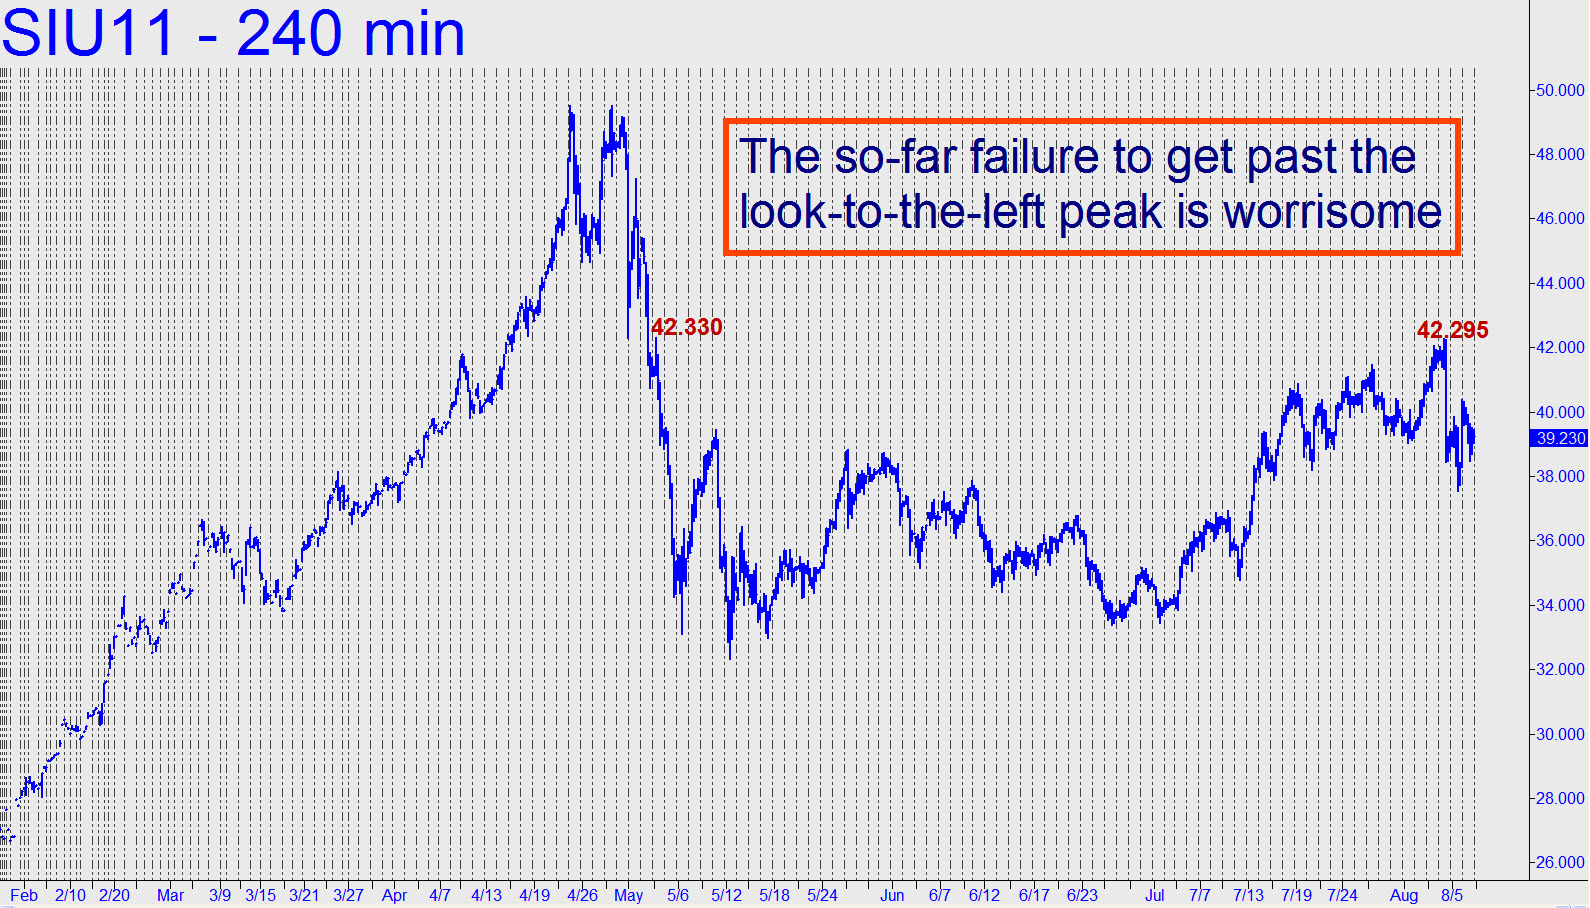
 Ordinarily, I would say don’t worry, Gold’s rampage will pull Silver higher no matter how timid buyers of the latter seem to have become. However, it will probably serve us better to read September Silver’s chart as though it were the chart of a stock we love to hate, such as Goldman Sachs. From that perspective, the failure of the last rally to exceed the look-to-the-left peak at 42.330 (see inset) must be acknowledged as a reason for doubt — or at least caution. More immediately, it would be sign of waxing strength if the day-old correction is able to turn without having breached a 38.030 midpoint support visible on the larger charts (240m, A=42.295 on 8/4; B=37.550 on 8/5). If not, the midpoint’s ‘d’ sibling at 35.660 will be in play. ______ UPDATE (2:53 a.m. EDT): Although there have been times when the Gold:Silver ratio was higher than the current 46, there may never have been a time when the day-to-day disconnect between the two was more pronounced. December Gold is up $43 at the moment, September Silver down 46 cents. If the purpose of this little exercise is to dampen speculation on Silver’s next run-up, it seems likely to work. Meanwhile, we shudder to imagine what would/will happen to Silver if Gold pulls back sharply.
