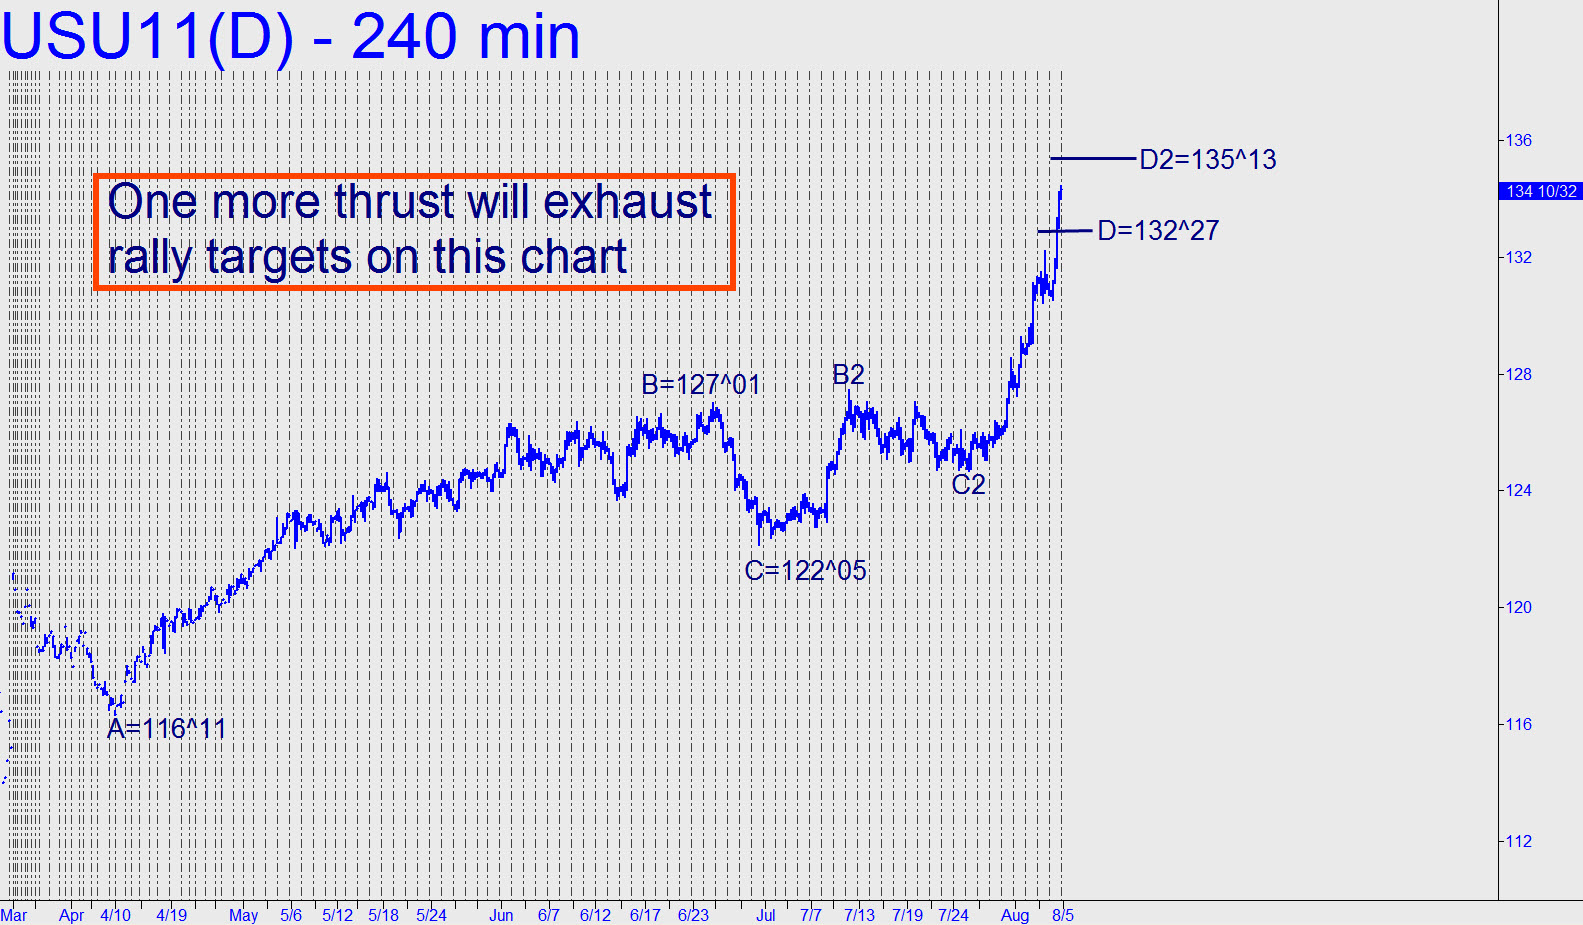
 Wow! The futures have blown through a major Hidden Pivot resistance at 132^27 so easily that the continuation of the bull market seems all but certain. For the present, I’ve extrapolated one last rally target at 135^13 from the 240-minute chart (see inset), but it will require a continuous chart to project any higher. The weekly chart is easily up to the task and envisions as high as — are you sitting down for this? — 143^11! (A=88^12 on June 15, 2007).
