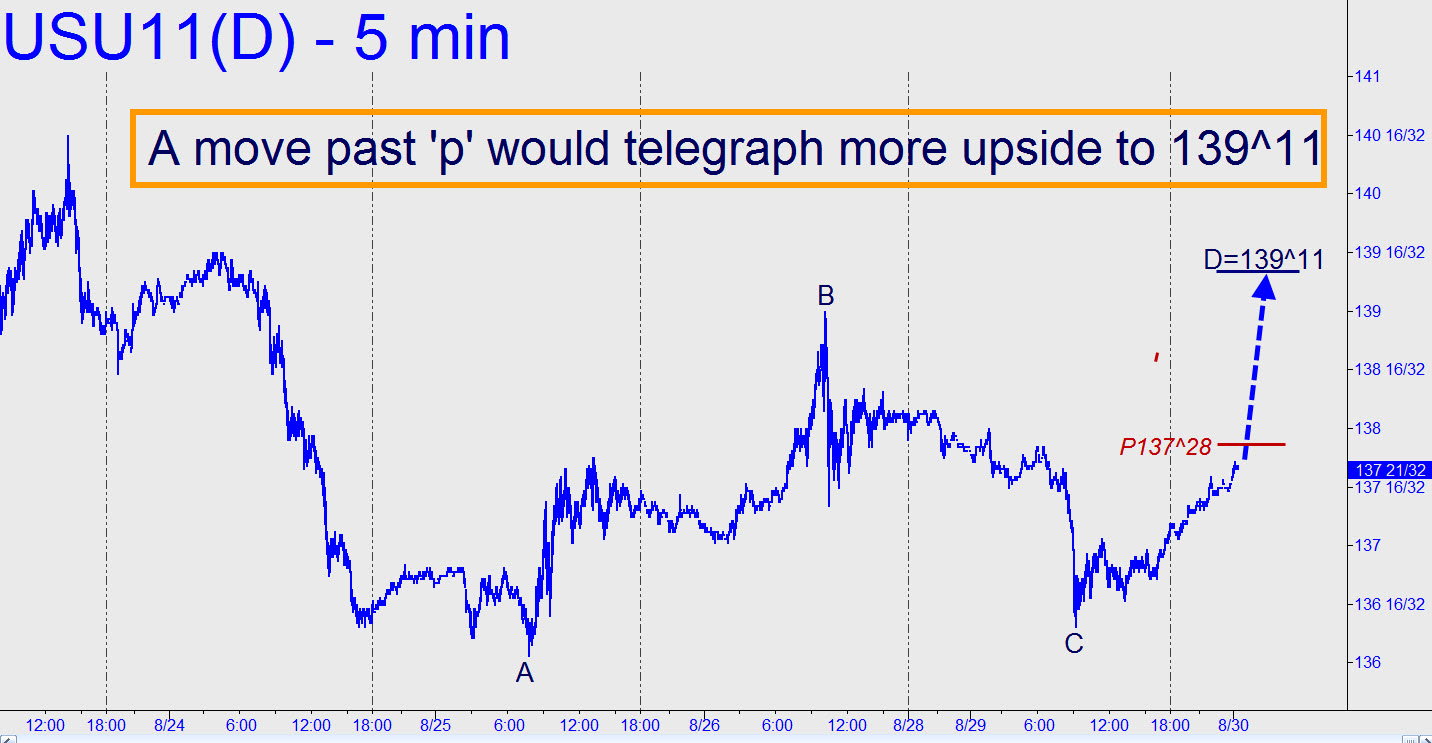
 A midpoint support at 136^25 has been violated by half-a-point, suggesting more downside awaits to 134^09. Accordingly, we should try to get short near the 137^28 midpoint resistance of the retracement pattern shown. Entry should be via camouflage only, based on the first bearish abc that occurs on the 15m chart or less. Please note that if the futures push higher without correcting to suit our needs, the logical rally target would be 139^11.
