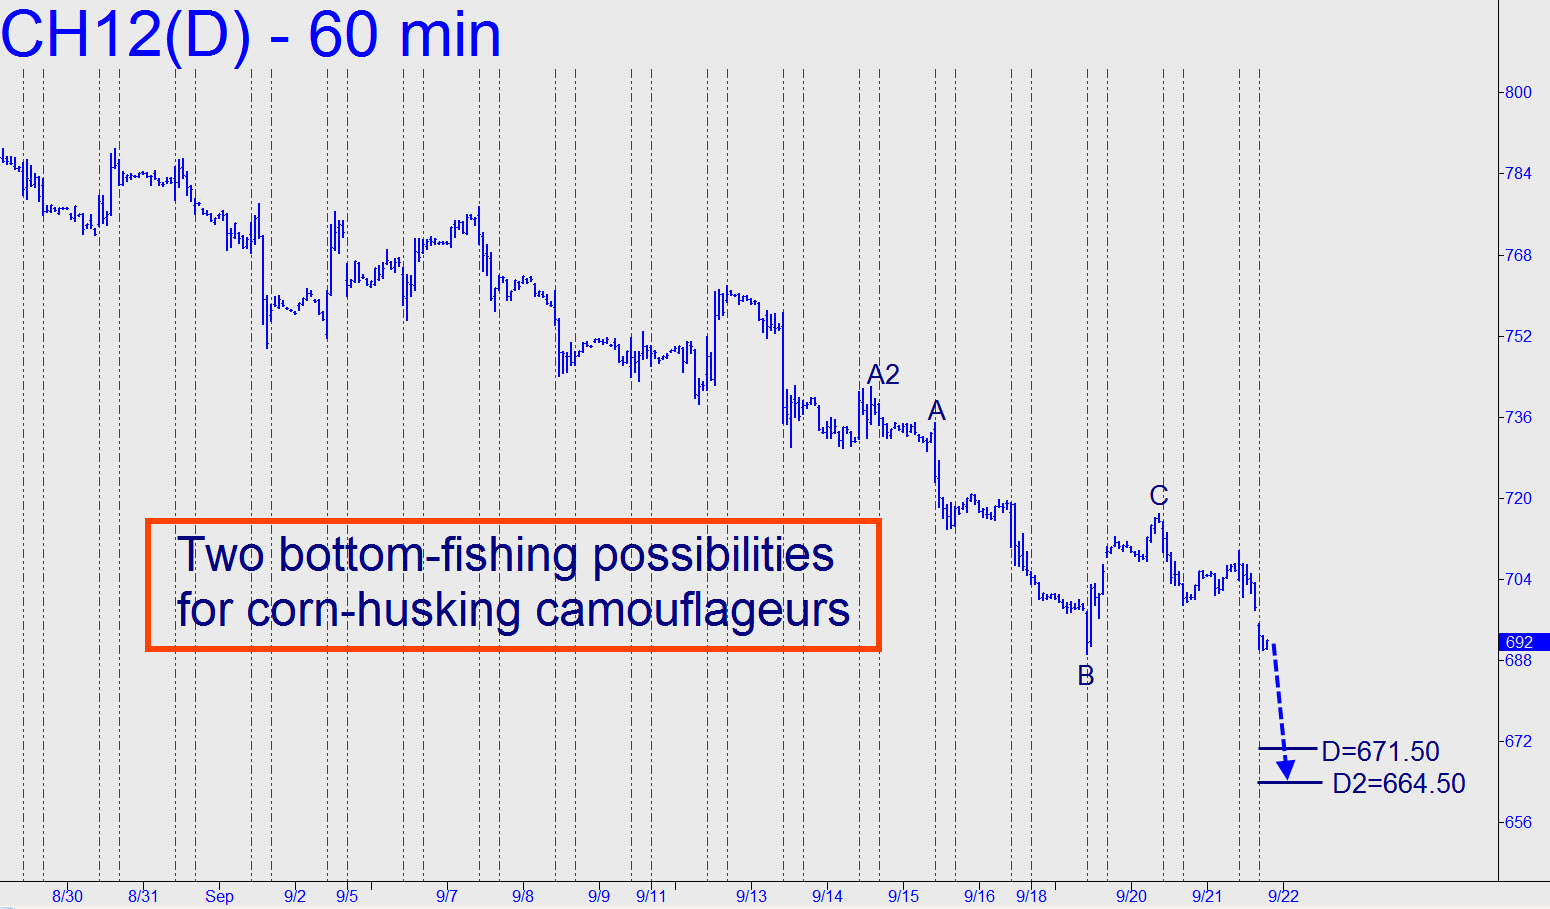
 Single-bar coordinates all around make the pattern shown in the chart an enticing one for finding a low-risk place to get long. Of the two possibilities shown, I prefer the higher Hidden Pivot support at 671.50. However, if it gives way easy, rebid (or re-camo) using the 664.50 target of the alternative pattern. _______ UPDATE (12:09 p.m. EDT): With commodities in a free fall today, March Corn has taken a 13-cent Whoopee Cushion bounce this morning from a low at 673.75. It has since returned to Earth and is about to crash-land, so we’ll cancel the trade. ______ FURTHER UPDATE (12:47 p.m. EDT): A chat-roomer has convinced me that there’s still a trade to be tried here, since the point ‘C’ of the original pattern was not disturbed by today’s mindless violence. However, if you look at the 60-minute chart, taking the mindless violence in at a glance, the eye naturally shifts north to higher points ‘A’ — i.e., 762 (9/12) or 756.75 (9/13). Under the circumstances, the safest trade I can recommend at the moment is to bid or camo-enter near 644.50. The risk is that the futures will turn from a low somewhere above this Hidden Pivot, but if you want to be certain not to miss the trade, you’ll need to try a camouflage entry at 664.50 first. That is the lower of the two numbers given above. You could also test the water at 671.50, as noted above, and although I would expect a nominally tradable bounce from that number, I doubt any rally would get very far.
