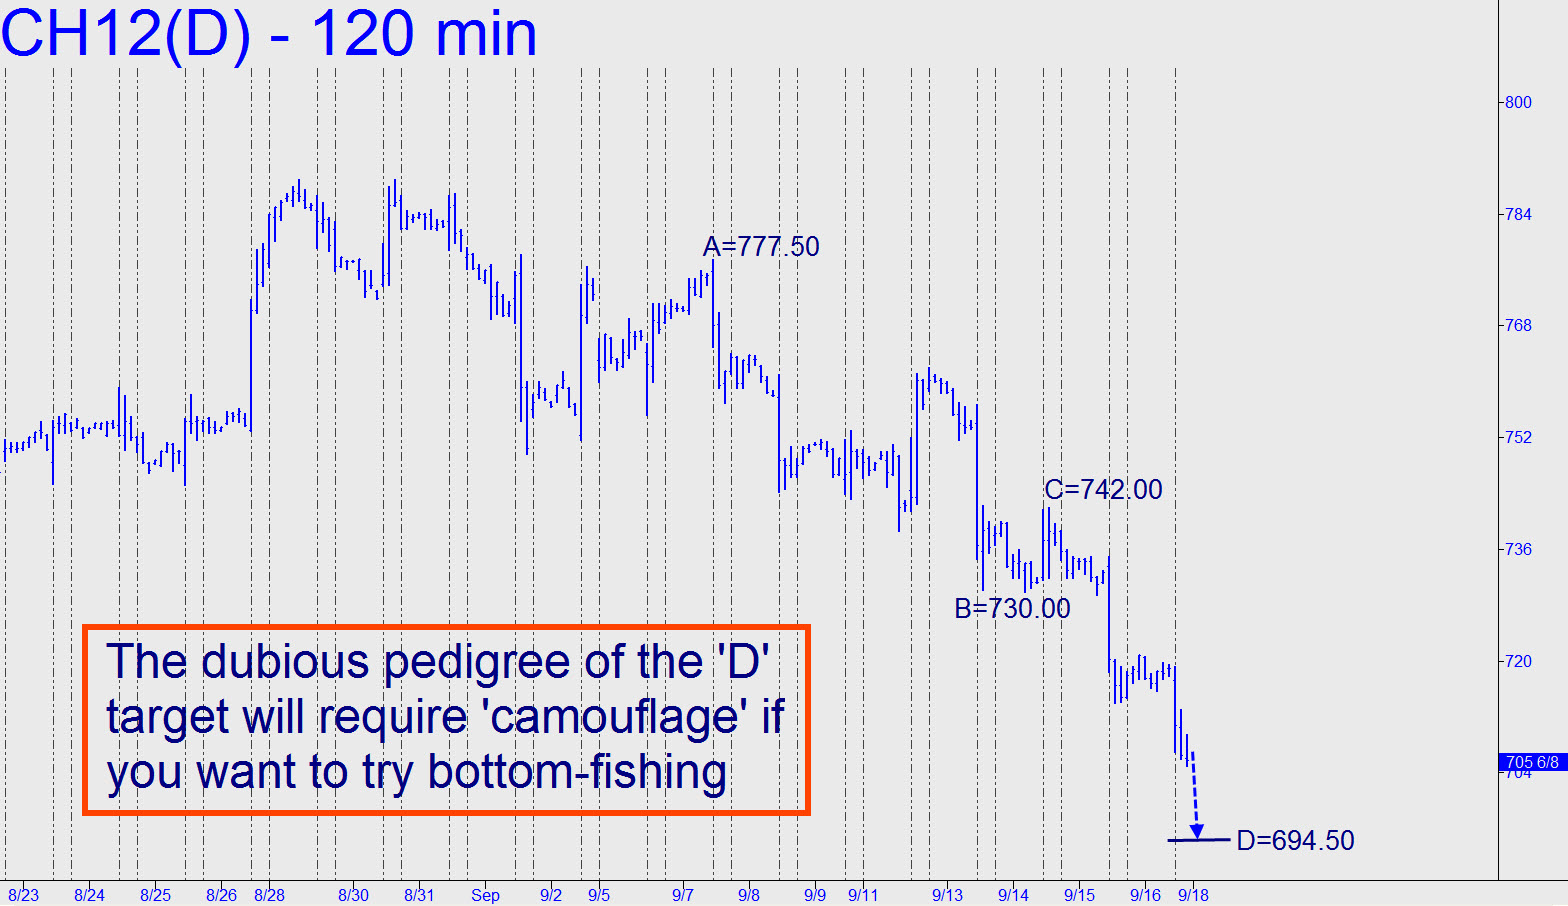
 The somewhat muddy corrective pattern shown in the chart hints of a tradable low at 694.50. However, because the pedigree of the Hidden Pivot is dubious, any longs from near it should be initiated via camouflage. To do so, I’ll recommend looking for the turn on the 5- or 10-minute chart if and when the futures come down reach 696.25. _______UPDATE (11:59 a.m. EDT): The bullish upturn came from 689.50, well below our Hidden Pivot retracement target, and the subsequent rallyeven on the one-minute chart yielded no patterns meeting our requirements for a ‘camouflaged’ entry opportunity. There will surely be others, though, so stay tuned.
