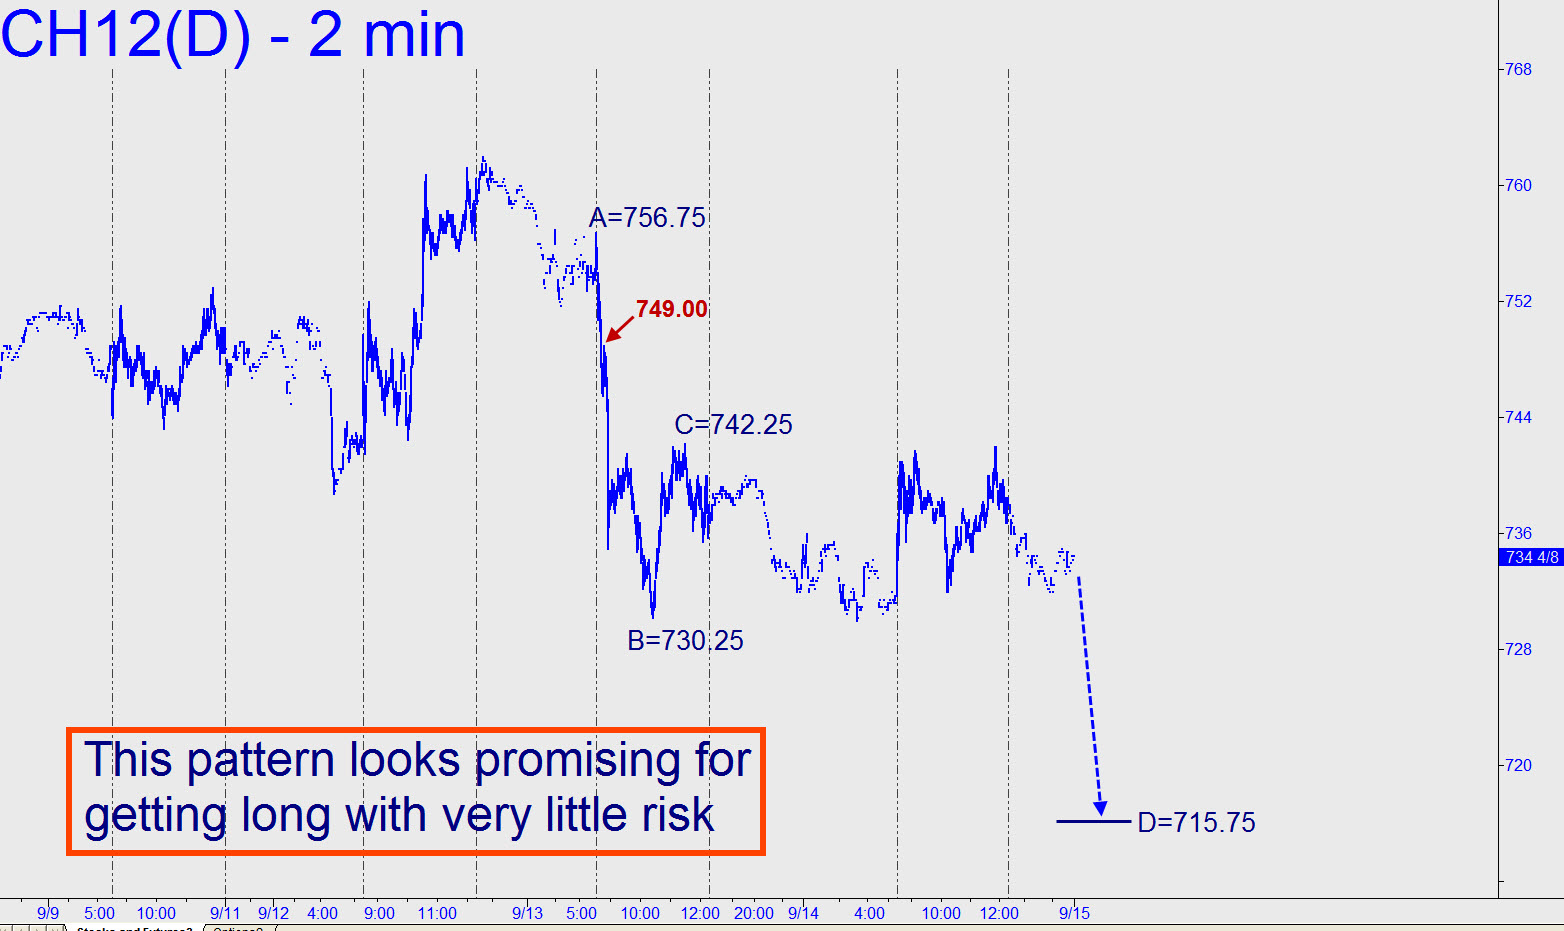
 The 715.75 target shown in this two-minute chart looks very enticing, so I’ll suggest buy-stopping the first point ‘x’ that occurs on an uptrending ABC pattern to get long. That is simple camouflage, although this pattern looks almost sweet enough to bottom-fish at the pivot itself with a one-point stop-loss. Note that there is also an ‘external’ peak at 749.00 that could come in handy not only for determining when bulls are back on the attack, but as a possible lever for a ‘camo’ trade if the futures don’t come down to our ‘d’ retracement target. _______ UPDATE (3:47 p.m.): The futures have been as low as 714 today, but the initial bounce of 5 cents from very near where we’d expected did not generate any camouflage entry opportunities, even on the one-minute chart. You should continue to look for such an opportunity at these levels, but be sure to apply the impulse-leg rules rigorously before taking the plunge. I am not spelling out those rules explicitly here because they are proprietary, but if you have concerns or doubts, I would encourage you to air them in the chat room.
