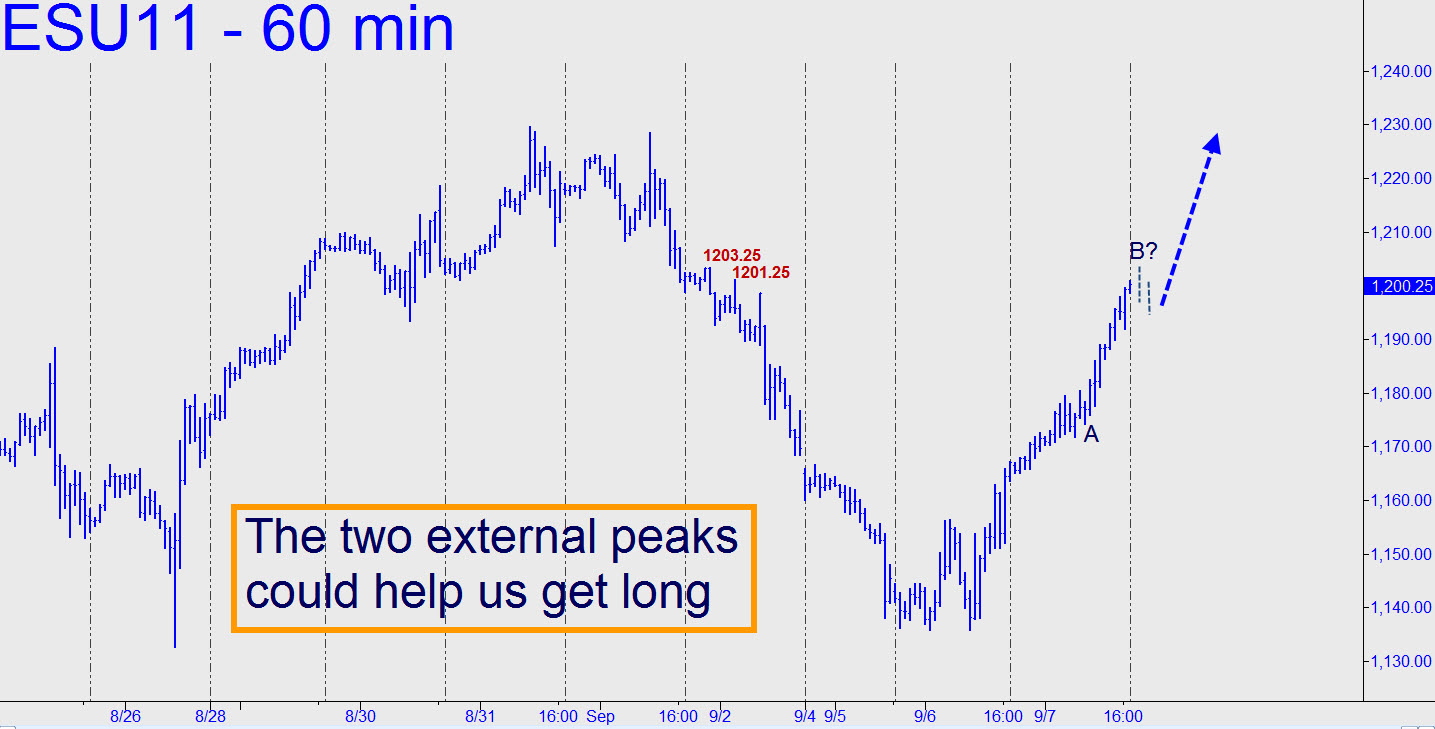
 After stalling briefly at the 1184.50 midpoint resistance noted here, the futures resumed their trek higher, presumably bound for the midpoint’s ‘D’ sibling at 1233.00. Pullbacks have been too shallow so far for camouflage, but I’ve identified two peaks that could help us find a tradable abc pattern Wednesday night if price action is felicitous.
