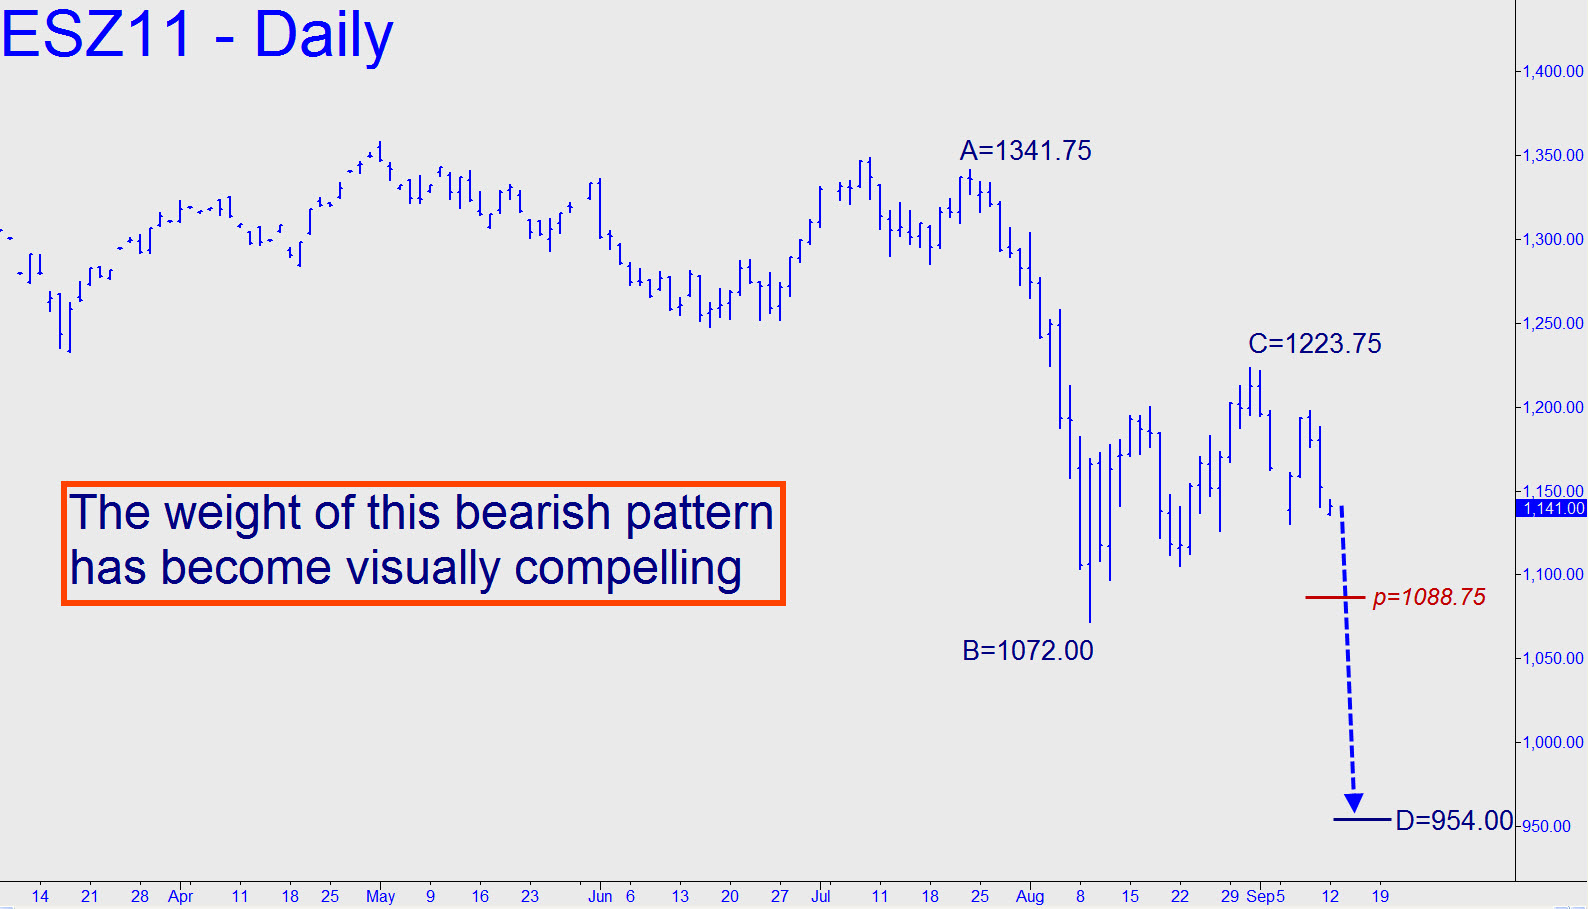
 Open up some space in the lower half of the daily chart and you can see how a fall to at least 1088.75, the midpoint support of the pattern show, has become visually unavoidable. It’s tied to a ‘D’ target at 954.00, so, presumably, there will be a long way to fall if and when the midpoint has been exceeded to the downside on a closing basis for two consecutive days. As of around 1:30 a.m. EDT, camouflage opportunities to get short were hard to find, since the downtrend was so well developed. A minor cycle on the 15-minute chart had surpassed an 1139.25 midpoint support, presumably bound for its ‘D’ sibling at 1133.75.
