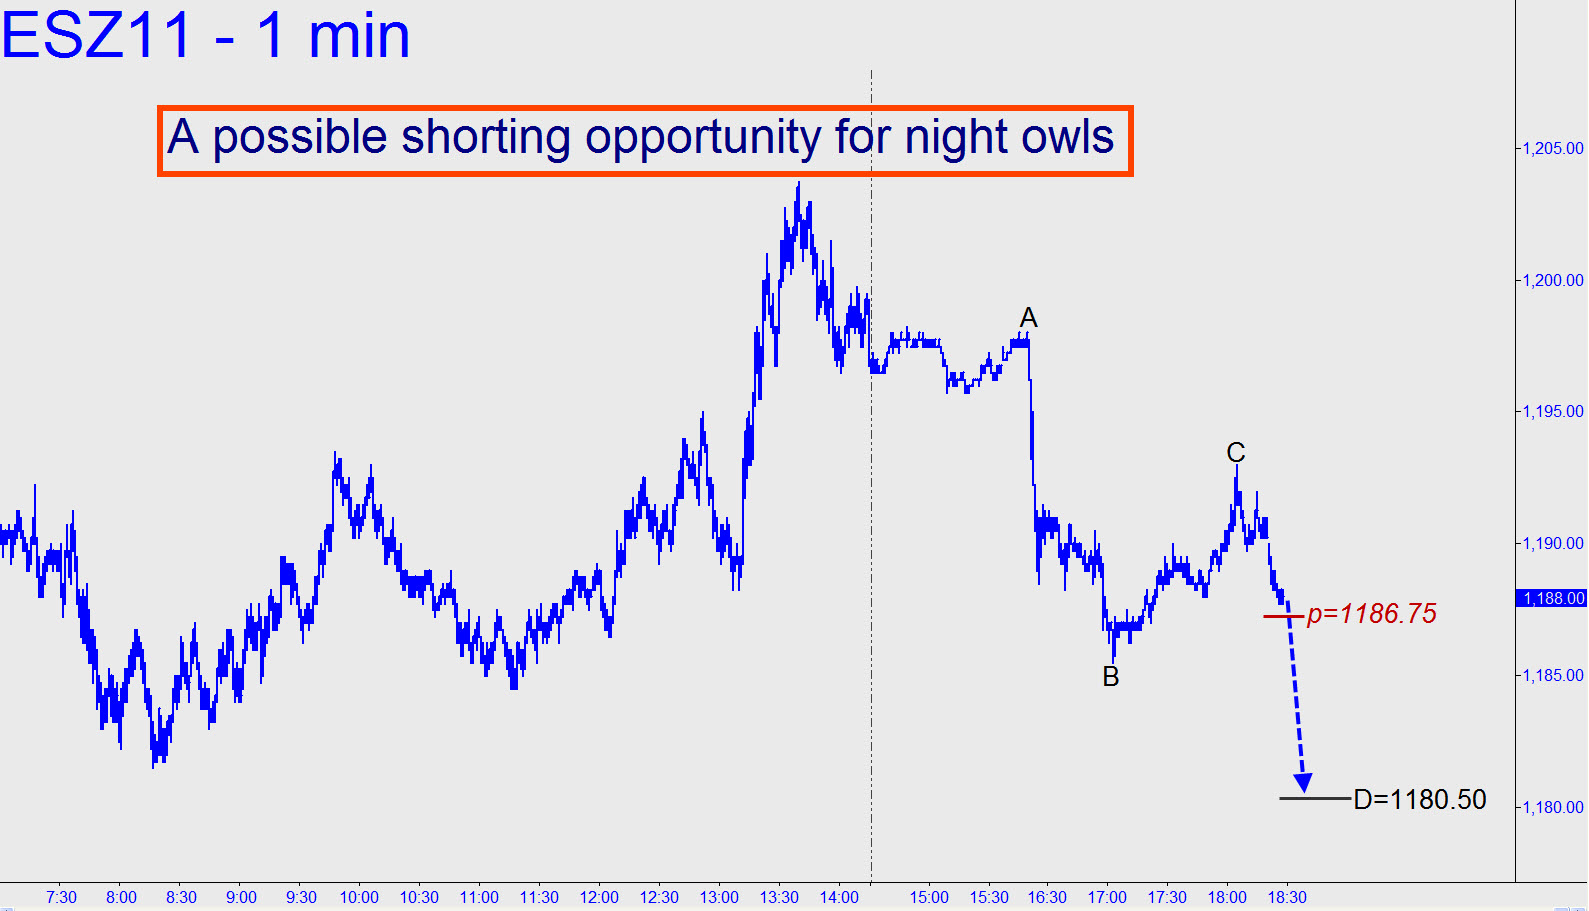
 Now in its sixth week, this excruciating distribution of stocks in a very probable bear market could induce seasickness in anyone tracking it too closely. Moreover, although the ups and downs seem slavishly mindful of Hidden Pivot supports and resistances, price action seems to be getting increasingly difficult to leverage with the usual camouflage tactics. We can deal with this by simply looking for subtler price reversals, but we shouldn’t expect to catch the next big-but-fleeting leg down in the Mother of All Bear Markets. For the moment, catching anything will require diligent attention to the lowly one-minute chart, on which a potentially shortable pattern (or perhaps a minor swing point worth bottom-fishing) is developing as I write these words.
