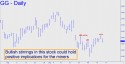
 Faint signs of life have appeared on the daily chart with Wednesday’s impulsive thrust above an important external peak at 48.39 from September 27. The old peak was exceeded by just 11 cents, but that is more than sufficient for us to infer that a second bull leg — or at least an attempt at one — lies in the offing. Because of the elongated k-A segment (see inset) the stock will need to come down to at least 45.42 to be considered fully corrected for a follow-through thrust, but there is no worse than an even-odds presumption at this point that this will occur. Stay tuned, since a rally in bellwether Goldcorp would obviously have bullish implications for the mining sector as a whole.
