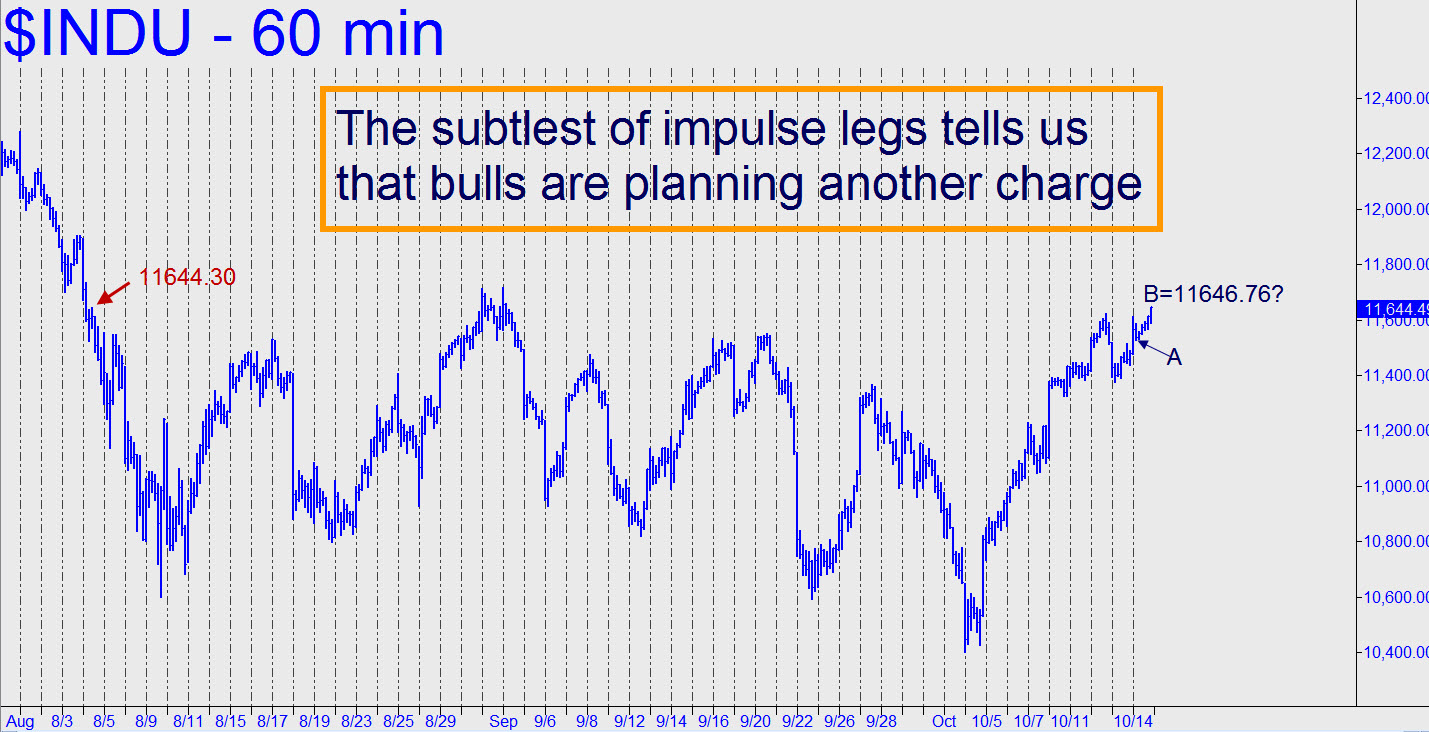
 As several eagle-eyed Pivoteers noted in the chat room, the conclusions I drew from the chart (see inset) were incorrect, since the external peak shown does indeed sit in the shadow of a higher one. Thus, it would take a print above the11904.84 peak recorded on August 3 to truly refresh the bullishness of the hourly chart. That wouldn’t be as subtle as the erroneous ‘breakout’ I’d inferred, but it would nonetheless keep bulls on the attack. Regardless, the bullish pattern at the right-hand edge of the chart is still tradable.
