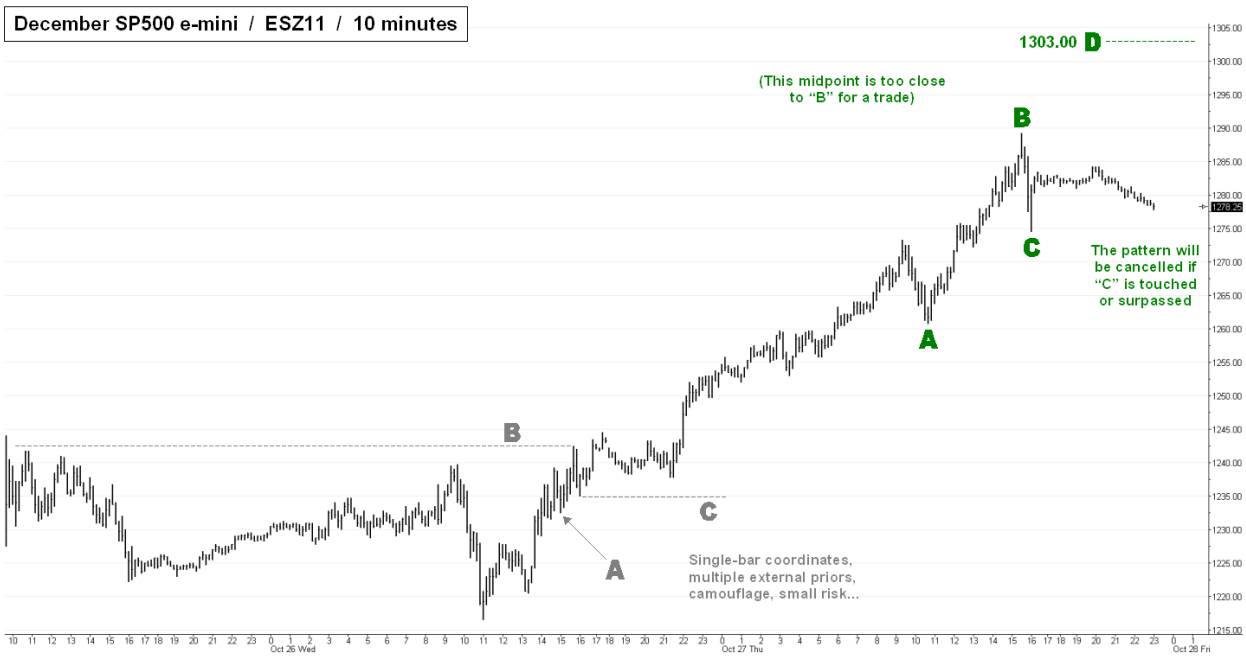
 Thursday’s powerful rally in equities left our active patterns in the dust, and a new one that emerged after the day’s high is under threat as the futures drift lower in night trading. The bull trend which launched off of the October 4 low still lacks “structure” in that the pullbacks along the way are too small to serve us as BC legs. In other words, the S&P500 is still impulsing upward 210 points later. This move will become serious business if and when it gets past the highs of early and mid-2011, less than 100 points further up. The small pattern that emerged yesterday targets 1303.00. Its midpoint is half a point below “B” (the rally high) and therefore not well hidden. Traders shorting 1303.00 should use a very tight pair of orders. If the “C” point at 1274.50 is touched or surpassed, the pattern will be voided. This is shown in the attached chart, which also illustrates why we all should have made a killing yesterday. (Posted by Doug “harry” McLagan)
