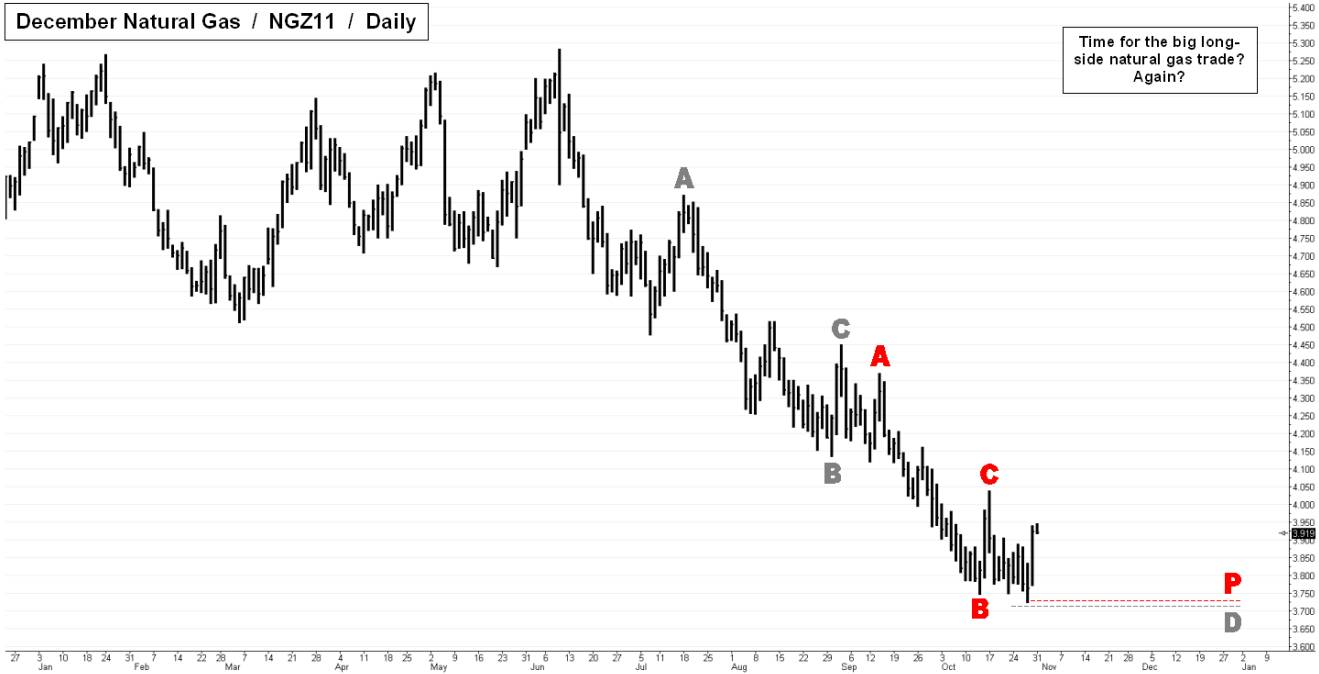
 Not for the first time since its epic collapse of 2008, natural gas looks like it might have made an important low. Many traders and investors keep an eye on the long-term natural gas charts in anticipation of another big uptrend from current low levels. There was a healthy rally two years ago, but since then, bottom-fishing nat gas has been a mug’s game. Yet the clean-burning fuel undeniably has value, and every two or three years its price explodes upward. The attached chart makes a hidden-pivot case for last week’s low as a turning point. The jagged intraday charts of natural gas futures are not to every trader’s liking, but if you have the direction right, the rewards can come quickly. Don’t venture onto this battlefield without your hidden-pivot weapons, and strictly limit the risks you take. (Posted by Doug “harry” McLagan)
