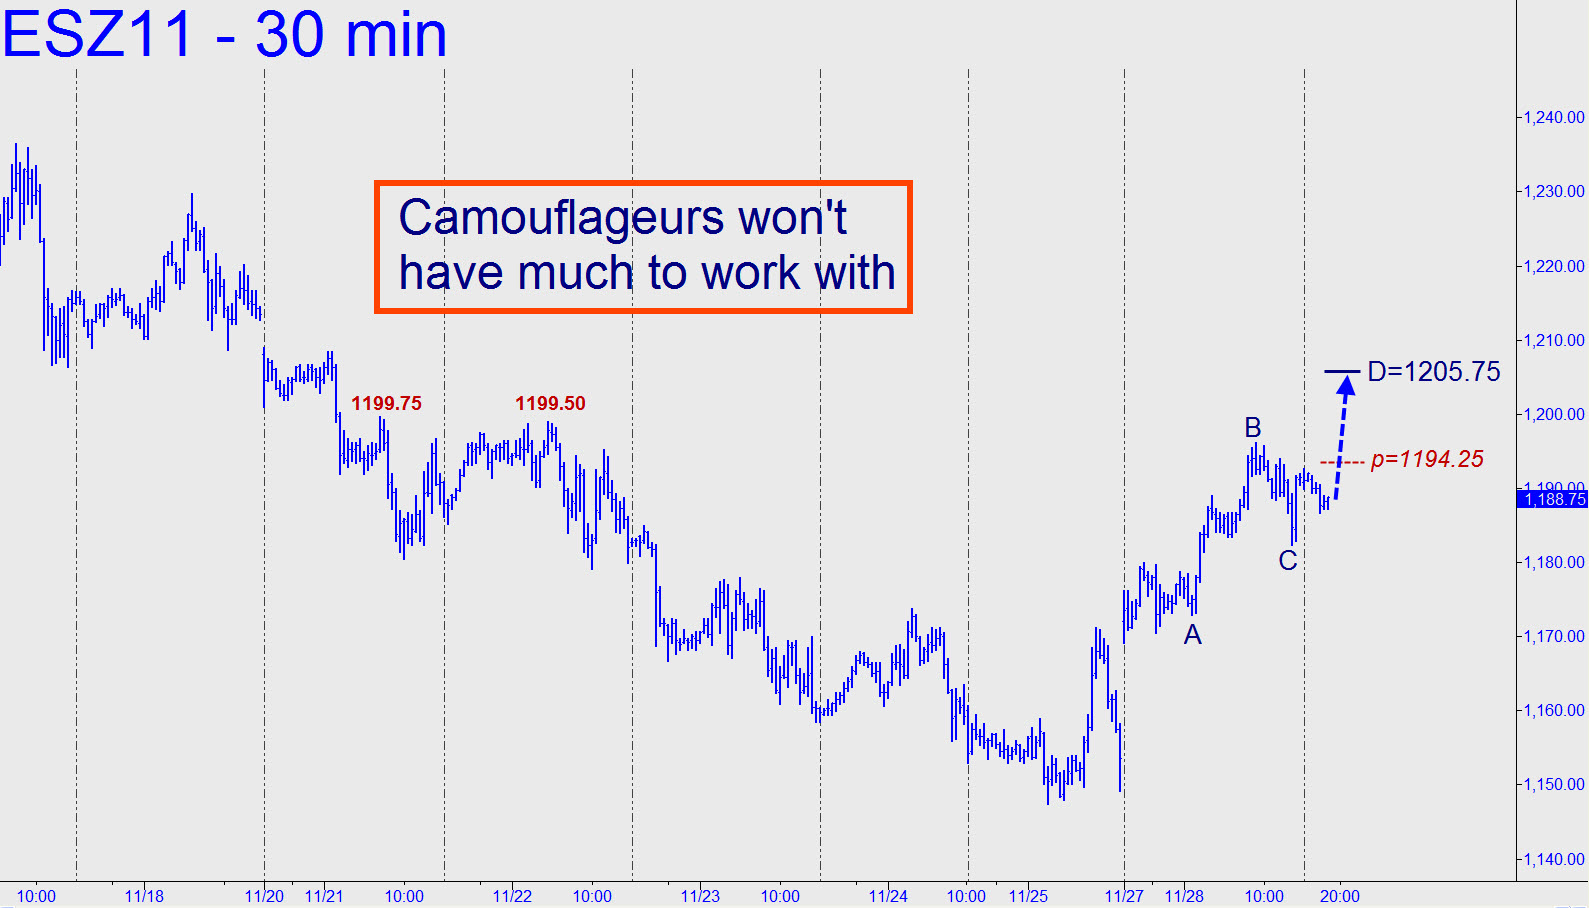
 I don’t trust this rally any farther than I could heave an anvil, but if you look at the chart and pretend it belongs to a trading vehicle that you like — gold, for instance — the short-term outlook is undeniably bullish. Assuming the 1182.50 point ‘C’ bottom of the pattern shown holds, the next pop should reach 1205.75, a Hidden Pivot, or perhaps a secondary target at 1208.25 if it’s exceeded. More immediately, the futures will need to get past the 1194.25 midpoint resistance tied to the lower target. Camouflageurs looking to get long won’t have much to work with, since the point ‘B’ of any micro-impulse leg you might use to do this would have to occur at exactly 1199.75. The chart shows why. ______ UPDATE (9:16 a.m. EST): The 1205.75 target caught the overnight top, 1206.00, within a single tick. The futures have since receded by a 13 points to a pre-opening low of 1193.00
