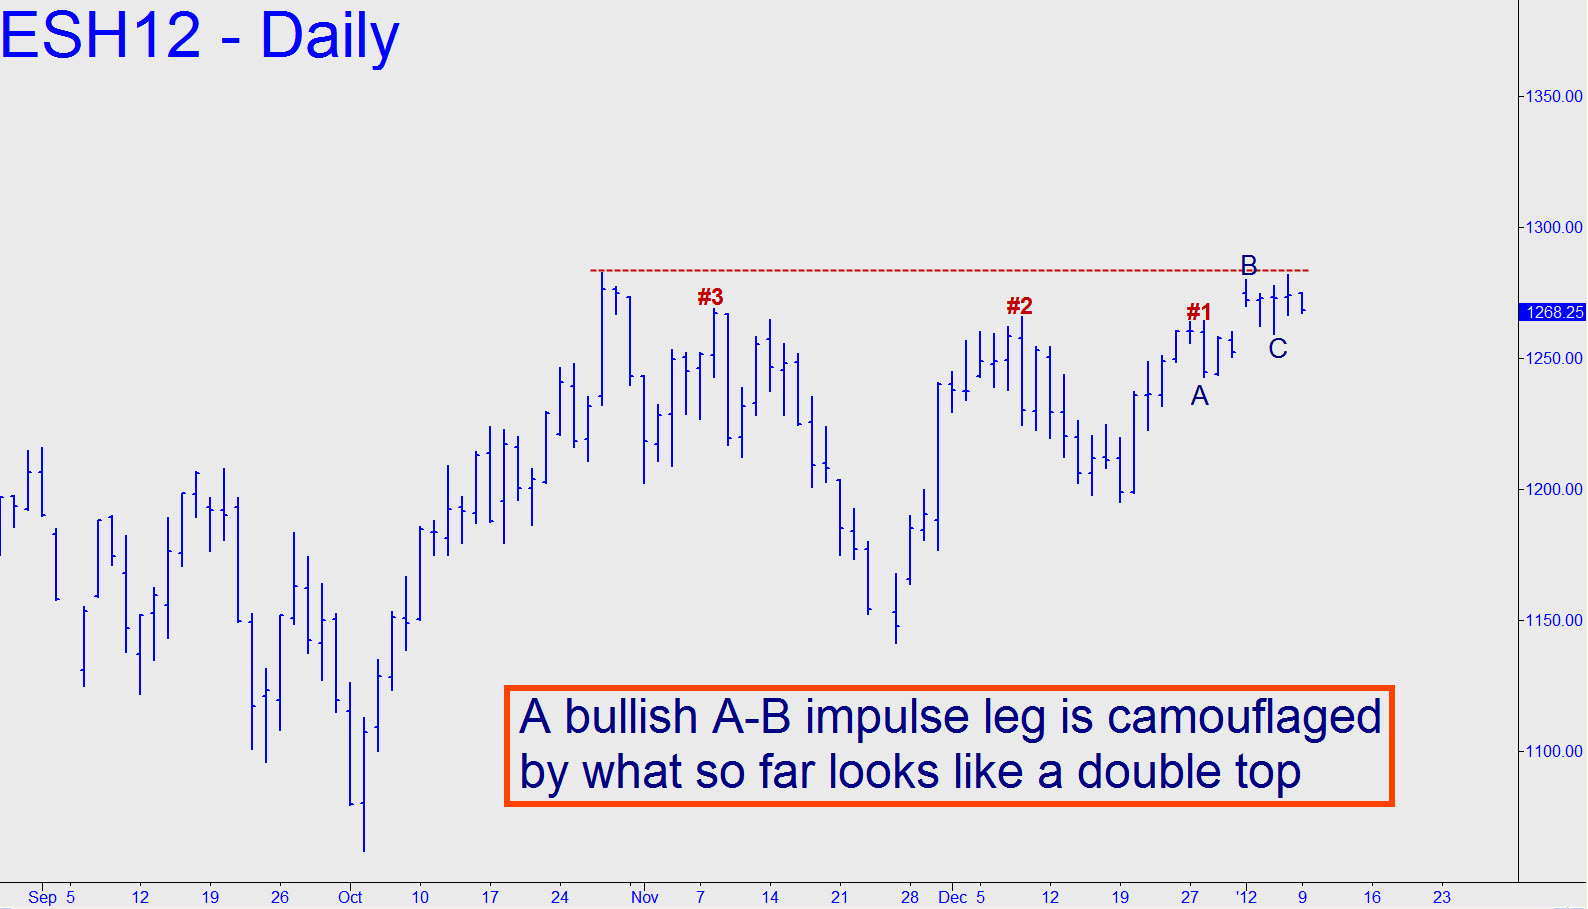
 What looks like a conventional double top on the daily chart is actually a bullish impulse leg that projects to 1296.75. The midpoint Hidden Pivot resistance associated with that number lies at 1278.25, and we should infer that a close above it would make a follow-through to the target an odds-on bet. More immediately, because the pullback from Friday’s very nasty bull-trap high offers no particularly promising spots for bottom-fishing., I’ll suggest looking for a camouflage opportunities based on ABC rallies on the one-minute chart. We’re zooming down all the way here because, as of around 9:13 p.m. Sunday night, I could find no camo opportunities on the two-minute chart.
