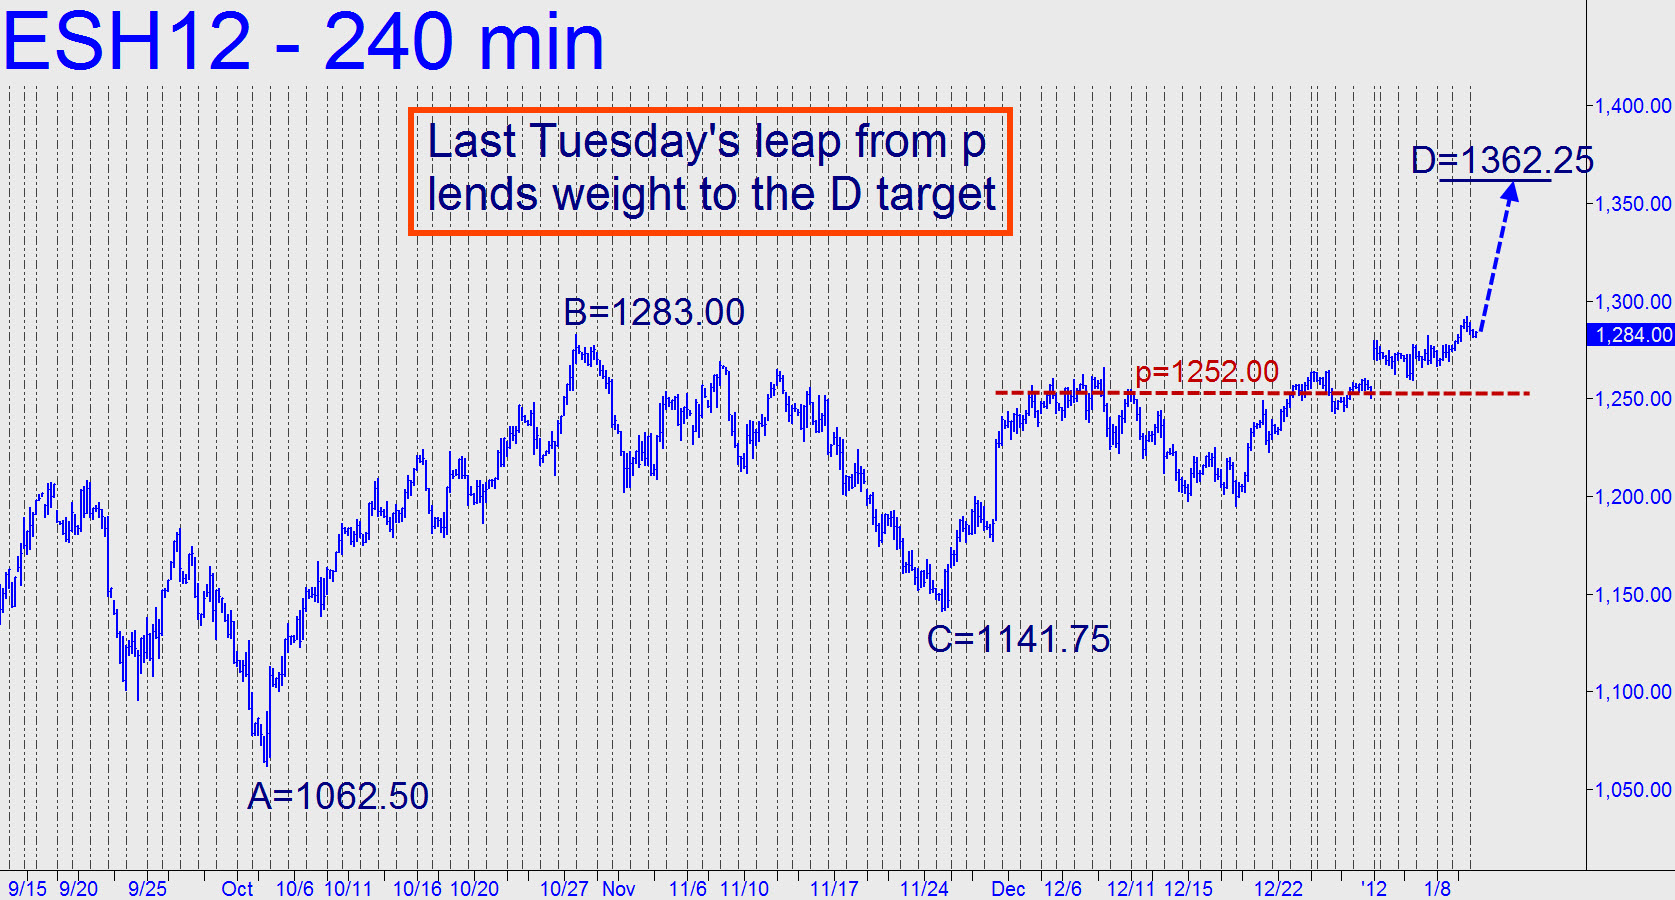
 We’ve been focused on relatively trivial — albeit tradable — rally targets recently, but the accompanying chart is intended to coax the bullish imagination a bit. It shows an ABC rally pattern stretching back to early October with a 1362.25 target. That’s equivalent to a Dow rally of about 700 points, which would boost the blue chip average comfortably above 13,000. The midpoint resistance associated with the target lies at 1252.00, and although the Hidden Pivot ‘effect’ at that price is not especially compelling, we should not overlook the fact that the futures have used it this week as a launching pad.
