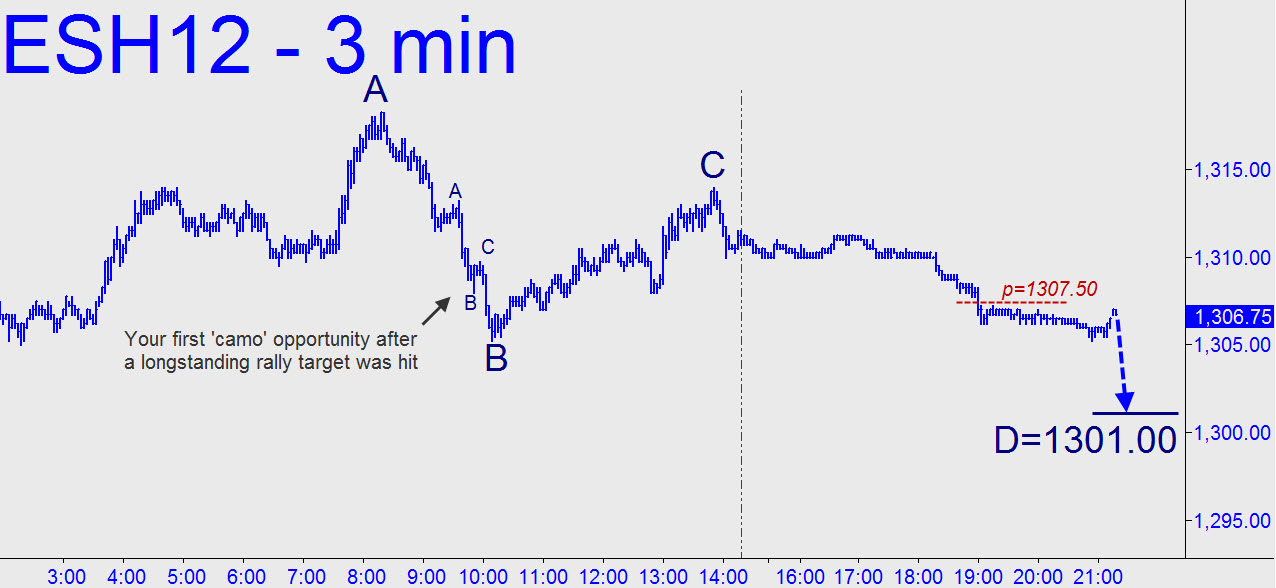
 A 1316.75 rally target we’d been using since, practically, the Mesozoic era got hit yesterday as the futures worked their way up to a slightly higher top at 1318.25. The subsequent selloff was shortable though not easily, even using camouflage. If you tried it, the first place you could have initiated a trade that met all of our requirements was at 1308.25 at around 12:03 p.m. (3-minute chart, a=1313.25, b=1308.00 and c=1309.75.) The joyride would have been short-lived but profitable. Now, night owls can look forward to moderate downside predicated on a 1301.00 Hidden Pivot target (see inset) that a recent webinar grad mentioned in the chat room. That’s not enough to shoot for, and, come to think of it, you might even get better odds trying to get long on the ‘3’ with a micro stop-loss. (Just don’t expect it to take you very far.)
