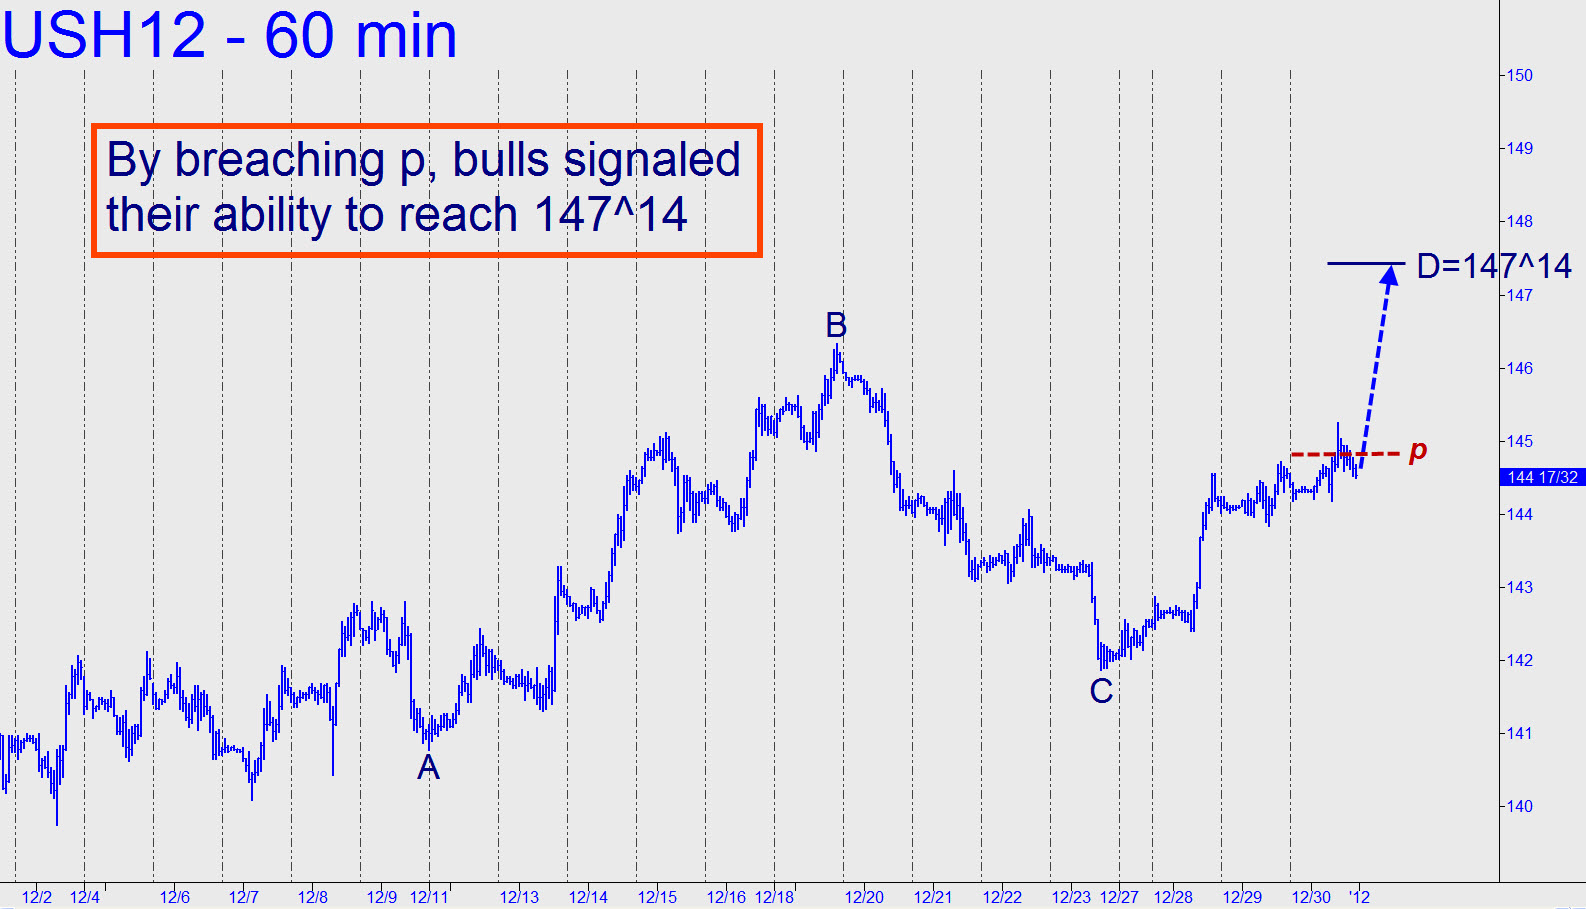
 By popping through a 144^21 midpoint resistance Friday, the futures showed themselves capable of continuing to its ‘D’ sibling, 147^14, at least. Camouflageurs looking for a bullish handhold will need to zoom down to the 15-minute chart, since there are no ‘external’ peaks to be found on the hourly below 145^23. On the ’15’, the first you’ll find — a very subtle look-to-the-lefter — lies at 145^13 (on 12/20 at 9:30 a.m.)
